"中国城市人口统计年鉴"相关数据
更新时间:2022-12-15为明确投资机构与教育品牌的联系,黑板洞察推出了《2020中国教育行业投资年鉴》。此书统计了十大热门赛道、百家投资机构、历数了投资事件,并配以可视化的图表,帮助读者快速理解重点信息。

 2019年中国各城市人口数量统计&中国各城市高校数量统计该数据为2019年中国各城市人口数量统计及高校数量统计2019年发布时间:2020-01-09
 2018年中国上海传统户外广告花费品牌统计Top10该数据包含了2018年中国上海传统户外广告花费品牌统计Top10。全景在2018年的花费同比变化为25.5829500013534%。2018年发布时间:2020-04-15
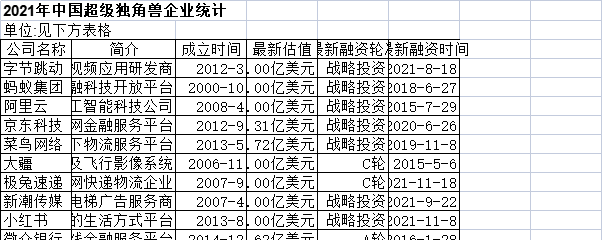
 2021年中国超级独角兽企业统计该数据包含了2021年中国超级独角兽企业统计。字节跳动简介为新闻聚合应用与娱乐视频应用研发商,成立时间为2012-3,最新估值为4200.00亿美元,最新融资轮次为战略投资,最新融资时间为2021-8-18。2021年发布时间:2022-01-14
 2019年中国师范学校改名统计该表为2019年师范学校改名统计。2019年发布时间:2020-04-13
 截至2018年中国教育行业大语文赛道统计该数据为截至2018年教育行业大语文赛道统计,包含了投资机构、投资轮次、业务细分、历史融资、地域分布等。2018年发布时间:2020-01-09
 2018年中国深圳广播广告花费品牌统计Top10该数据包含了2018年中国深圳广播广告花费品牌统计Top10。深圳前海交广微贷易金融服务有限公司在2018年的花费同比变化为-36.7355071865583%。2018年发布时间:2020-04-15
 截至2018年4月中国教师培训赛道统计表本文档为教师培训赛道统计表,表格包含品牌名称、业务梳理、投融资事件、成立时间等详情。2018年发布时间:2020-01-09
 2018年中国北京杂志广告花费品牌统计Top10该数据包含了2018年中国北京杂志广告花费品牌统计Top10。香奈儿在2018年的花费同比变化为34.8312322082147%。2018年发布时间:2020-04-15
 2019年中国部分教育公司下沉城市分布该数据为国内部分教育公司下沉分布,由北上广迁移至其他城市。2019年发布时间:2020-01-09
 2021年国外超级独角兽企业统计该数据包含了2021年国外超级独角兽企业统计。Stripe简介为美国支付解决方案服务商,公司城市为美国,成立时间为2010-1,最新估值为950.00亿美元,最新融资轮次为G轮。2021年发布时间:2022-01-14
 2021年蜂巢能源融资历程统计该数据包含了2021年蜂巢能源融资历程统计。2020/6/8轮次为战略投资,金额为10亿人民币,投资方为国投招商。2021年发布时间:2022-01-14
 2021年中国5次及以上参投IPO独角兽的投资方统计该数据包含了2021年中国5次及以上参投IPO独角兽的投资方统计。腾讯投资参投次数为34,参投独角兽为10,参投2021年IPO独角兽为快手 滴滴出行 京东物流 满帮集团 涂鸦智能 知乎 联易融 水滴 每日优鲜 微泰医疗。2021年发布时间:2022-01-14
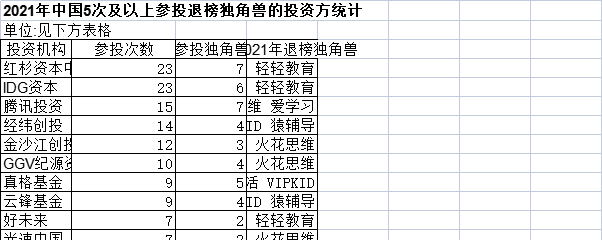
 2021年中国5次及以上参投退榜独角兽的投资方统计该数据包含了2021年中国5次及以上参投退榜独角兽的投资方统计。红杉资本中国参投次数为23,参投独角兽为7,参投2021年退榜独角兽为出门问问 药明明码 云鸟科技 VIPKID 作业帮 火花思维 轻轻教育。2021年发布时间:2022-01-14
 2021年艾博生物融资历程统计该数据包含了2021年艾博生物融资历程统计。2019/5/13轮次为天使轮,金额为数百万人民币,投资方为泰福资本TF Capital。2021年发布时间:2022-01-14
 2019年印度教育学制及功能统计2019年印度教育学制及功能统计。2019年发布时间:2020-04-13
 2021年锅圈食汇融资历程统计该数据包含了2021年锅圈食汇融资历程统计。2019/8/12轮次为A轮,金额为4500万人民币,投资方为不惑创投。2021年发布时间:2022-01-14
 1967-2019年中国垂直电商领域创企的成立时间情况按地域分布统计该统计数据包含了1967-2019年垂直电商领域创企的成立时间情况按地域分布统计。2019年广东省垂直电商领域创企数量为两家。1967-2019年发布时间:2020-07-16
 1994-2019年中国芯片领域创新企业公司融资事件按地域和时间分布情况统计该统计数据包含了1994-2019年芯片领域创新企业公司融资事件按地域和时间分布情况统计。2019年,芯片领域创新企业公司融资事件在北京地区最多,共37起。1994-2019年发布时间:2020-07-16
 2021年T3出行融资历程统计该数据包含了2021年T3出行融资历程统计。2019/3/25轮次为战略投资,金额为数十亿人民币,投资方为阿里巴巴 腾讯投资 苏宁 东风汽车 一汽 长安汽车 荣巽 南京领行 无锡飞叶 南京恒创。2021年发布时间:2022-01-14
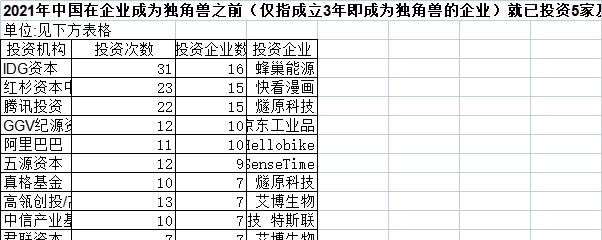
 2021年中国在企业成为独角兽之前(仅指成立3年即成为独角兽的企业)就已投资5家及以上的资方统计该数据包含了2021年中国在企业成为独角兽之前(仅指成立3年即成为独角兽的企业)就已投资5家及以上的资方统计。IDG资本投资次数为31,投资企业数为16,投资企业为百度昆仑芯片 滴滴货运 壁仞科技 运立方 小鹏汇天 小冰 Cider 思谋科技 小马智行Pony.ai 锅圈食汇 鲸灵集团 古北水镇 嬴彻科技 商汤科技SenseTime 特斯联 蜂巢能源。2021年发布时间:2022-01-14


