"网络设备"相关数据
更新时间:2024-11-052018年美国网络设备受众调查报告
Considering what connecting with media was like five, 10 or 20 years ago, consumers today are pretty lucky. They can customize their media behaviors and fit them perfectly with their needs- be it their life schedule, their interests or their location. While some consumers embrace this personalization, others are keen to be complacent and lean into what they are accustomed to. Both groups have options, however. That much is undeniable.
I've embraced this ability to curate my own media and often wake up talking to my smart speaker about the weather. I follow by tuning the radio in the car during the first leg on my hike into the Nielsen office. And then on my train-ride commute, I get digitally whimsical by either listening to music via a smartphone app, watching programs I downloaded before leaving home or flipping through the digital pages of an e-book.
This may sound similar to your content journey, but it's probably not exactly the same, given the innumerable choices literally at our fingertips. Marketers looking to capitalize on such rich engagement opportunities need to reach consumers with a like-minded approach to personalization, utilizing marketing strategies that account for this new cross-media world.
【更多详情,请下载:2018年美国网络设备受众调查报告】

 2020年中国传输网络设备市场的规模及市场增长率情况该统计数据包含了2020年中国传输网络设备市场的规模及市场增长率情况。光通信设备的市场规模最高,市场规模580亿美元。2020年发布时间:2021-11-05
 2018年中国网络视频用户对终端设备的使用情况该统计数据包含了2018年网络视频用户对终端设备的使用情况。使用智能手机的网络视频用户占比98%。2018年发布时间:2019-07-24
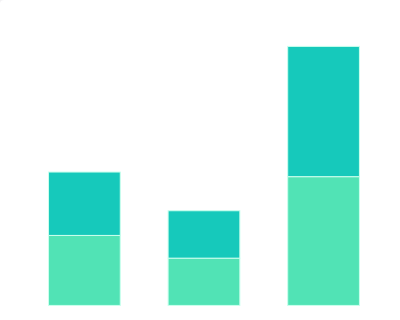 2017-2018年中国互联网络的接入设备使用情况该统计数据包含了2017-2018年中国互联网络的接入设备使用情况。2018年互联网络接入手机的占比最高,占比98.6%。2017-2018年发布时间:2021-09-01
 2018年全球联网智能设备僵尸网络控制规模情况本数据记录了2018年中国联网智能设备僵尸网络控制规模,其中1千至5千僵尸网络个数(按控制端IP 地址统计)294个2018年发布时间:2019-11-19
 2018年中国不同城市级别网络视频用户对终端设备的使用情况该统计数据包含了2018年不同城市级别网络视频用户对终端设备的使用情况。2018年三线城市网络视频用户使用智能手机终端设备的比例为98.9%。2018年发布时间:2019-07-24
 2020年3月和6月中国互联网络接入设备使用情况该统计数据包含了2020年3月和6月中国互联网络接入设备使用情况。其中,2020年3月互联网络接入台式电脑占比为42.7%。2020年发布时间:2021-03-12
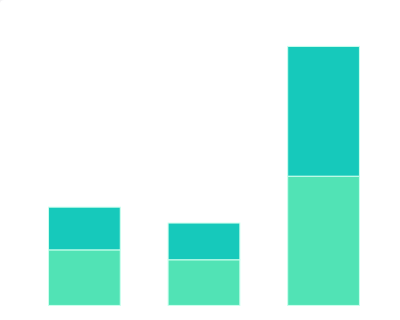 2020年3月和12月中国互联网络接入设备的使用率情况该统计数据包含了2020年3月和12月中国互联网络接入设备的使用率情况。2020.12互联网络接入手机的使用率最高,使用率99.7%。2020年发布时间:2021-08-13
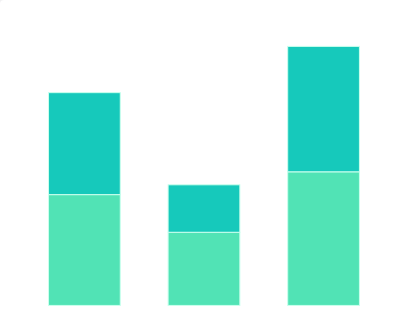 2014年中国城乡互联网络接入设备使用情况该统计数据包含了2014年中国城乡互联网络接入设备使用情况。城镇手机占比最高,占比87.3%。2014年发布时间:2020-07-17
 2015年12月和2016年6月中国互联网络的接入设备使用情况该统计数据包含了2015年12月和2016年6月中国互联网络的接入设备使用情况。2016.06互联网络接入手机的占比最高,占比92.5%。2015-2016年发布时间:2021-08-27
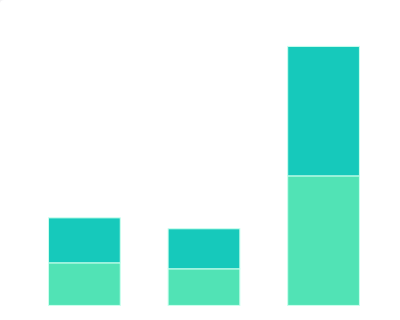 2020年12月和2021年6月中国互联网络接入设备的使用情况该统计数据包含了2020年12月和2021年6月中国互联网络接入设备的使用情况。2020.12互联网络接入手机使用的占比最高,占比99.7%。2020-2021年发布时间:2021-10-22
 2018年12月和2019年6月中国互联网络接入设备的使用情况该统计数据包含了2018年12月和2019年6月中国互联网络接入设备的使用情况。2019.06互联网络接入手机使用的占比最高,占比99.1%。2018-2019年发布时间:2021-09-01
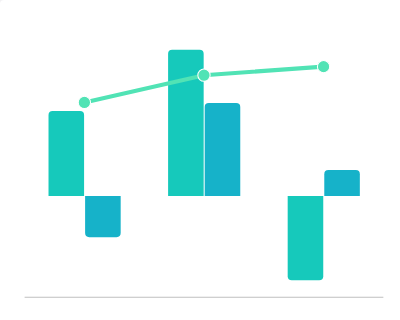 2022年中国网络招聘APP月总独立设备数分布该统计数据包含了2022年中国网络招聘APP月总独立设备数分布。2022年发布时间:2024-09-03
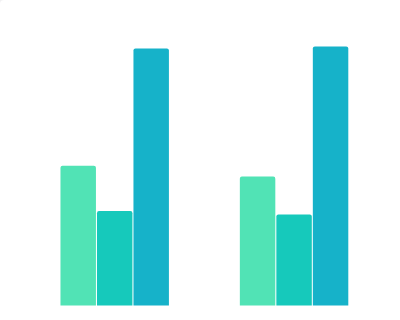 2017年12月和2018年6月中国互联网络接入设备使用占比的情况该统计数据包含了2017年12月和2018年6月中国互联网络接入设备使用占比的情况。2018年6月互联网络接入台式电脑设备使用占比达到了48.9%。2017-2018年发布时间:2020-07-09
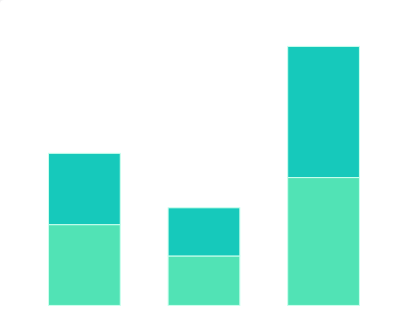 2016-2017年中国互联网络接入设备使用占比的情况该统计数据包含了2016-2017年中国互联网络接入设备使用占比的情况。2017年互联网络接入台式电脑设备使用占比达到了53.0%。2016-2017年发布时间:2020-07-17
 2017年南非日常使用网络时间该统计数据包含了2017年南非日常使用网络时间。南非人民平均每天花费8.32小时通过任何设备使用互联网。2017年发布时间:2019-03-26
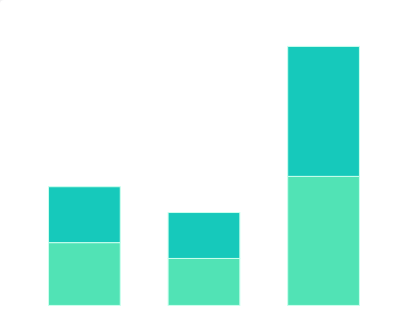 2018年12月和2020年3月中国互联网络接入设备使用情况该统计数据包含了2018年12月和2020年3月中国互联网络接入设备使用情况。2020.03手机使用占比最高,占比99.3%。2018-2020年发布时间:2020-07-24
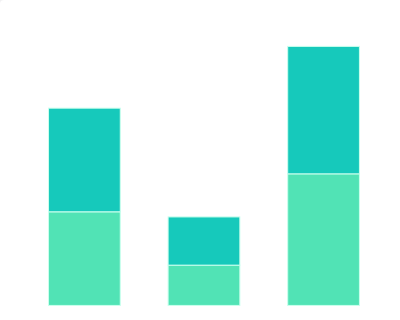 2013-2014年中国农村互联网络接入设备使用情况该统计数据包含了2013-2014年中国农村互联网络接入设备使用情况。2013年手机占比最高,占比84.6%。2013-2014年发布时间:2020-07-17
 2020年中国网络综艺节目的网络特色体现分布情况该统计数据包含了2020年中国网络综艺节目的网络特色体现分布情况。互动形式,如互动综艺、边播边买等的占比最高,占比77.1%。2020年发布时间:2021-07-30
 2020年中国不同群体智能可穿戴设备使用留存比例(按性别划分)该统计数据包含了2020年中国不同群体智能可穿戴设备使用留存比例(按性别划分)。其中男性留存率为68.34%。2020年发布时间:2021-06-25
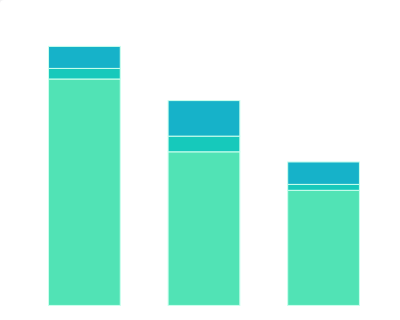 2021年中国网络视频用户使用网络视听应用频率分布该统计数据包含了2021年中国网络视频用户使用网络视听应用频率分布。调查数据显示,53.5%的受访用户每天都会看短视频,只有34.9%的人偶尔看。2021年发布时间:2022-08-26


