"台风灾害与海浪年鉴"相关数据
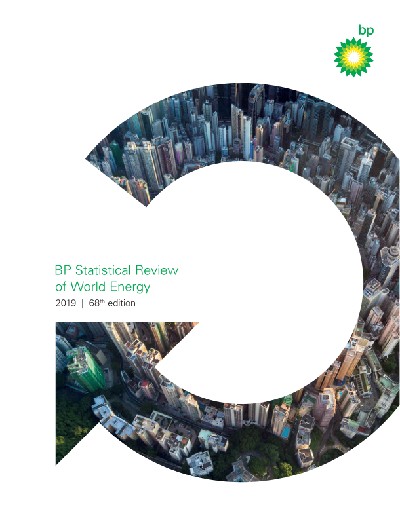
更新时间:2024-10-302019世界能源统计年鉴
In particular,the data compiled in this year's Review suggest that in 2018,global energy demand and carbon emissions from energy use grew at their fastest rate since 2010/11,moving even fur ther away from the accelerated transition envisaged by the Paris climate goals.
BP's economics team estimate that much of the rise in energy growth last year can be traced back to weather-related effects,as farmilies and businesses increased their demand for cooling and heating in response to an unusually large number of hot and cold days.The acceleration in carbon emissions was the direct result of this increased energy consumption.
Even if these weather effects are short-lived,such that the growth in energy demand and carbon emissions slow over the next few years,there seems lttle doubt that the current pace of progress is inconsistent with the Paris climate goals.The world is on an unsustainable path:the longer carbon emissions continue to rise,the harder and more costly will be the eventual adjustment to net-zero carbon emissions.Yet another year of growing carbon emissions underscores the urgency for the world to change.
The Statistical Review provides a timely and objective insight into those developments and how that change can begin to be achieved.
The strength iท energy consumption was reflected acroรs all the fuels,many of which grew more strongly than their recent historical averages.This acceleration was particularly pronounced for natural gas,which grew at one of its fastest rates for over 30 years,accounting for over 40% of the growth in primary energy.On the supply side,the data for 2018 reinforced the central importance of the US shale revolution.
【更多详情,请下载:2019世界能源统计年鉴】

 2018年中国海浪灾害主要损失情况该统计数据包含了2018年中国海浪灾害主要损失情况。其中,4月6日浙江海浪灾害直接经济损失1002万元。2018年发布时间:2021-05-07
 2019年中国海浪灾害过程及损失情况该统计数据包含了2019年中国海浪灾害过程及损失情况。其中,12月5日福建海浪灾害直接经济损失1200万元。2019年发布时间:2021-05-07
 2019年中国沿海各省海浪灾害主要损失情况该统计数据包含了2019年中国沿海各省海浪灾害主要损失情况。其中,福建直接经济损失0.22亿元。2019年发布时间:2021-05-07
 2018年中国沿海各省份海浪灾害主要损失情况该统计数据包含了2018年中国沿海各省份海浪灾害主要损失情况。其中,浙江损毁船只7艘。2018年发布时间:2021-05-07
 截至2020年世界对台风名称的分类该统计数据包含了截至2020年世界对台风名称的分类。其中以动物命名的占比为24.29%。2020年发布时间:2020-08-03
 2018年8月12-14日台风摩羯风暴潮中国受灾害省份损失情况该统计数据包含了2018年8月12-14日台风摩羯风暴潮中国受灾害省份损失情况。其中,上海直接经济损失0.54亿元。2018年发布时间:2021-05-07
 2018年9月16-17日台风山竹风暴潮中国受灾害省份损失情况该统计数据包含了2018年9月16-17日台风山竹风暴潮中国受灾害省份损失情况。其中,广东直接经济损失23.70亿元。2018年发布时间:2021-05-07
 2018年7月21-24日台风安比风暴潮中国受灾害省份损失情况该统计数据包含了2018年7月21-24日台风安比风暴潮中国受灾害省份损失情况。其中,浙江省直接经济损失0.89亿元。2018年发布时间:2021-05-07
 2018年7月10-11日台风玛莉亚风暴潮中国受灾害省份损失情况该统计数据包含了2018年7月10-11日台风玛莉亚风暴潮中国受灾害省份损失情况。其中,福建直接经济损失11.39亿元。2018年发布时间:2021-05-07
 2018年8月16-20日台风温比亚风暴潮中国受灾害省份损失情况该统计数据包含了2018年8月16-20日台风温比亚风暴潮中国受灾害省份损失情况。其中,江苏直接经济损失0.58亿元。2018年发布时间:2021-05-07
 2014年中国各地区洪涝、山体滑坡、泥石流和台风自然灾害损失情况该统计数据包含了2014年各地区洪涝、山体滑坡、泥石流和台风自然灾害损失情况。2014年河北洪涝、山体滑坡、泥石流和台风自然灾害损失4.84万公顷。2014年发布时间:2018-11-26
 1900年至2019年全球记录的自然灾害事件数量该统计数据包含了1900年至2019年全球记录的自然灾害事件数量。二十世纪初到现在,自然灾害数量已呈现缓慢下降趋势。1900-2019年发布时间:2020-07-29
 1950-2018年中国洪涝灾害受灾情况该统计数据包含了1950年至2018年中国洪涝灾害受灾情况。近年来,洪涝灾害受灾面积在减小,但是经济损失却在增加。1950-2018年发布时间:2020-07-29
 1949-2014年中国台风极值强度分布情况该统计数据包含了1949-2014年我国台风极值强度分布情况。1949-2014年,共有385个台风达到超强台风级。1949-2014年发布时间:2020-07-30
 1949年-2019年中国逐月平均生成台风个数该统计数据包含了1949年至2019年逐月平均生成台风个数。其中八月份平均生成台风个数最多,达5.68个。1949-2019年发布时间:2020-07-30
 2019年中国沿海各省主要海洋灾害损失情况该统计数据包含了2019年中国沿海各省主要海洋灾害损失情况。其中,浙江直接经济损失87.35亿元。2019年发布时间:2021-05-07
 1949年-2020年中国夏季与秋季台风初次登陆时的强度分布该统计数据包含了1949年-2020年中国夏季与秋季台风初次登陆时的强度分布。1949年-2020年中国夏季与秋季台风初次登陆时的强度为强台风及超强台风的占比分别为14.9%和22.4%。2020年发布时间:2022-09-15
 1949-2014年中国台风年均登陆次数该统计数据包含了1949-2014年我国台风年均登陆次数。台风登陆地的前三甲分别是广东、台湾、海南。1949-2014年发布时间:2020-07-30
 2019年不同风暴潮灾害中中国直接经济损失情况该统计数据包含了2019年不同风暴潮灾害中中国直接经济损失情况。其中,1904"木恩"台风风暴潮直接经济损失0.12亿元。2019年发布时间:2021-05-07
 2014年中国各地区风雹灾害自然灾害损失情况该统计数据包含了2014年各地区风雹灾害自然灾害损失情况。2014年北京风雹灾害自然灾害受灾面积为2.72万公顷。2014年发布时间:2018-11-26


