"什么网站可以下统计年鉴"相关数据
更新时间:2024-11-262019世界能源统计年鉴
In particular,the data compiled in this year's Review suggest that in 2018,global energy demand and carbon emissions from energy use grew at their fastest rate since 2010/11,moving even fur ther away from the accelerated transition envisaged by the Paris climate goals.
BP's economics team estimate that much of the rise in energy growth last year can be traced back to weather-related effects,as farmilies and businesses increased their demand for cooling and heating in response to an unusually large number of hot and cold days.The acceleration in carbon emissions was the direct result of this increased energy consumption.
Even if these weather effects are short-lived,such that the growth in energy demand and carbon emissions slow over the next few years,there seems lttle doubt that the current pace of progress is inconsistent with the Paris climate goals.The world is on an unsustainable path:the longer carbon emissions continue to rise,the harder and more costly will be the eventual adjustment to net-zero carbon emissions.Yet another year of growing carbon emissions underscores the urgency for the world to change.
The Statistical Review provides a timely and objective insight into those developments and how that change can begin to be achieved.
The strength iท energy consumption was reflected acroรs all the fuels,many of which grew more strongly than their recent historical averages.This acceleration was particularly pronounced for natural gas,which grew at one of its fastest rates for over 30 years,accounting for over 40% of the growth in primary energy.On the supply side,the data for 2018 reinforced the central importance of the US shale revolution.
【更多详情,请下载:2019世界能源统计年鉴】
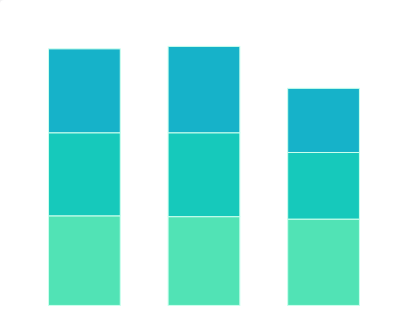 2019年中国在线视频网站24岁以下用户特征分析该统计数据包含了2019年中国在线视频网站24岁以下用户特征分析。其中,爱奇艺网站24岁以下用户独立设备数TGI为109。2019年发布时间:2021-01-27
 2018年意大利主要网站的社交网络参与情况(按互动次数统计)该数据包含了2018年意大利主要网站的社交网络参与情况(按互动次数统计)。Fanpage.it互动次数为20165997次。2018年发布时间:2019-09-26
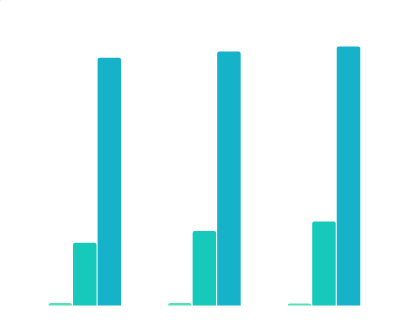 2005-2017年英国电影网站数量(按项目统计)该数据包含了2005-2017年英国电影网站数量(按项目统计)。2005南亚为5个,专业为132个,主流为522个。2005-2017年发布时间:2019-04-26
 2002-2017年英国电影网站数量(按类型统计)该数据包含了2002-2017年英国电影网站数量(按类型统计)。2017多厅影院*为348家,传统和混合用途影院为426家。2002-2017年发布时间:2019-04-26
 2018年中国24岁以下用户最喜欢的TOP10网站(月覆盖人数大于1000万)情况该统计数据包含了2018年中国24岁以下用户最喜欢的TOP10网站(月覆盖人数大于1000万)情况。2018年斗鱼成为中国24岁以下用户最喜欢的网站,TGI为198。2018年发布时间:2019-07-11
 2017年香港女性认为患卵巢癌最危险的年龄统计该统计数据包含了2017年香港女性认为患卵巢癌最危险的年龄统计。2017年香港45-54岁女性认为患卵巢癌最危险的比例有35.9%。2017年发布时间:2019-03-26
 2019年中国受访者关于“什么造就成功”的统计情况本数据记录了2019年中国受访者“什么造就成功”,其中努力工作占比66%2019年发布时间:2019-11-19
 2018年中国春运期间为了可以顺利出行,您愿意妥协的因素统计该统计数据包含了2018年我国春运期间为了可以顺利出行,您愿意妥协的因素统计。51.9%的人群会在路途时间上做出妥协。2018年发布时间:2020-07-23
 2018年英国主要的保险网站(按广告占有率统计)该数据包含了2018年英国主要的保险网站(按广告占有率统计)。moneysupermarket.com2018年12月为20.7%。2018年发布时间:2019-09-12
 2017年中国分省网站数量及占网站总数比例的情况该统计数据包含了2017年中国分省网站数量及占网站总数比例的情况。2017年广东省网站数量达到了777464个,占网站总数比例达到了14.6%。2017年发布时间:2020-07-17
 2017年英国影院参展商排名(按电影网站的数量统计)该数据包含了2017年英国影院参展商排名(按电影网站的数量统计)。Others (16 major exhibitors and 258 independent single venue exhibitors)网站数为308个。2017年发布时间:2019-04-26
 2017年中国政府网站用户来源类型分布情况该统计数据包含了2017年中国政府网站用户来源类型分布情况。直接访问来源占比最高,占比45.57%。2017年发布时间:2020-07-16
 2017年中国政府网站国际用户占比情况该统计数据包含了2017年中国政府网站国际用户占比情况。国内用户占比最高,占比99.3。2017年发布时间:2020-06-17
 2019年中国90后受访者关于“你的兴趣是什么”的统计情况本数据记录了2019年中国90后受访者“你的兴趣是什么”,其中音乐占比62%2019年发布时间:2019-11-19
 2017年中国政府网站导航来源渠道分布情况该统计数据包含了2017年中国政府网站导航来源渠道分布情况。政府网站互链占比最高,占比55.08%。2017年发布时间:2020-07-16
 2017年中国政府网站用户回访时间分布情况该统计数据包含了2017年中国政府网站用户回访时间分布情况。1天之内回访率最高,回访率42%。2017年发布时间:2020-07-16
 2017年中国政府网站用户平均访问页面数情况该统计数据包含了2017年中国政府网站用户平均访问页面数情况。市县区部门网站用户平均访问页面数最高,平均访问页面数3.69页。2017年发布时间:2020-07-16
 2015年中国二线及以下城市观影群体认为可以刺激国产片观影兴趣的因素TOP5分布情况该统计数据包含了2015年中国二线及以下城市观影群体认为可以刺激国产片观影兴趣的因素TOP5分布情况。剧情合理、饱满的占比最高,占比20.1%。2015年发布时间:2020-10-16
 2017-2018年访问英国艺术网站的原因该统计数据包含了2017-2018年访问英国艺术网站的原因。2017-2018年访问英国艺术网站的原因是“了解有关活动的相关信息”占比最高,为72.4%。2017-2018年发布时间:2019-04-26
 2017年中国政府网站社交媒体来源渠道分布情况该统计数据包含了2017年中国政府网站社交媒体来源渠道分布情况。微信占比最高,占比88.49%.2017年发布时间:2020-07-16


