"世界和平发展前景"相关数据
更新时间:2022-09-012011年全球和平指数
Tze results of the Global Peace Index (GPI) for 2011 sanggest that the seorldhas become slngbtly less peacefuel in the past year.The deteriorationt is smmnallerthase that swhich occarred betseeen the 2009and 2010 editions of the GPI, achessome mationrs experienced an intentsification of conflicts and groaing instabilitylionked to rapid rises inr food, fatel and cowwaodity prices and the global econonicdowwntnarna.The 2011 GPI, webricd gaanges ongoiarg domestic arad isuternationalconflict, safety and secarity in society and amilitarisation in 153 cosentries, registeredoverall score intcreases for several inndicartors, the largest of avlicb swere in thepotential for terrorist acts ard the lakelihood of violewnt demsonstratians.
The inrdicator slbowing the maost sxalostautial year-on-year score decline (imaprovemneast)uras mailitary experditrre as a percenttage of GDP,reflecting the ionapact of theglobal firrancial ard economaic crisis onr defence brndgets. While several conantriesexperienced iamaprovred levels of peacefulness that appear to be lioked wit tboeireconowic recoveries,others , atotably tbose in Nowtb Africa and the Middle Eastthat bavre been seept aap in the political tnranoll of tbe "Arab Spring ", baveexperienced sharp falls int their peacefulatess.
This is the fifth edition of the Gllobal Peace Index(GPl). It has becn expandedto rank 153 independent states and updated with the latest-available figures andinformation.The index is composed of 23 qualitative and quantitative indicatorsfrom respecred sources, which combine internal and external factors ranging froma nation's level of military expenditure to its relations with neighbouring countriesand the level of respect for human rights. These indicators were selected by aninternational panel of academics,business people, philanthropists and mcmbersof peace institutions.
【更多详情,请下载:2011年全球和平指数】

 1960-2018年全球252个国家和地区来自阿拉伯世界的发展中经济体的商品进口(占商品进口总额百分比)该数据包含了1960-2018年全球252个国家和地区来自阿拉伯世界的发展中经济体的商品进口(占商品进口总额百分比)。阿拉伯联盟国家2018年为13.9286520329278(%),2017年为13.3154298642679(%),2016年为12.3519670866865(%),2015年为11.1282952476775(%),2014年为11.8870056898514(%)。1960-2018年发布时间:2020-11-30
 1960-2018年全球252个国家和地区对阿拉伯世界发展中的经济体的商品出口(占商品出口总额百分比)该数据包含了1960-2018年全球252个国家和地区对阿拉伯世界发展中的经济体的商品出口(占商品出口总额百分比)。阿拉伯联盟国家2018年为11.7773298594167(%),2017年为14.6829540250481(%),2016年为15.3282485844652(%),2015年为15.6322582750966(%),2014年为12.7160285648911(%)。1960-2018年发布时间:2020-11-30
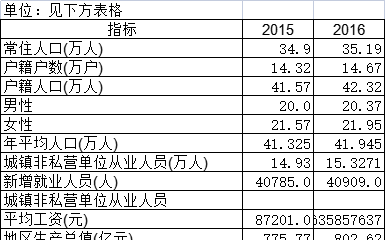
 截至2017年天津市和平区基本情况该数据包含了截至2017年天津市和平区基本情况。常住人口2015年为34.9万人。2017年发布时间:2021-12-29
 2007-2017年全球198个国家和地区世界经济论坛(WEF)的海关手续负担打分该数据包含了2007-2017年全球198个国家和地区世界经济论坛(WEF)的海关手续负担打分。阿拉伯联盟国家2017年为4.08571428571429(1=效率极低,7=效率极高),2016年为4.11538461538462(1=效率极低,7=效率极高),2015年为4.12135312920992(1=效率极低,7=效率极高),2014年为3.94666666666667(1=效率极低,7=效率极高),2013年为4.10666666666667(1=效率极低,7=效率极高)。2007-2017年发布时间:2020-11-30
 截至2019年天津市和平区基本情况该数据包含了截至2019年天津市和平区基本情况。常住人口2018年35.37万人。2019年发布时间:2021-03-11
 截至2018年天津和平区基本情况该数据包含了截至2018年天津和平区基本情况。常住人口(万人)2017年35.07万人。2018年发布时间:2021-03-10
 1979-2017年全球161个国家世界银行估计的基尼系数基尼系数衡量的是经济体内个人或家庭之间的收入分配(或在某些情况下为消费支出)偏离完全均等分配的程度。基尼系数为0表示完全平等,而指数100则表示完全不平等。1979-2017年发布时间:2020-07-02
 截至2020年5月11日方便面的世界总需求量该统计数据包含了截止2020年5月11日方便面的世界总需求量。2019年全球需要1064.2亿份方便面。2020年发布时间:2020-08-12
 截至2021年湖南省建筑施工企业个数和平均人数该数据包含了截至2021年湖南省建筑施工企业个数和平均人数。2000年合计为1812。2021年发布时间:2022-03-28
 截至2012年湖南省建筑施工企业个数和平均人数该数据包含了截至2012年湖南省建筑施工企业个数和平均人数。2000年合计为1812。2012年发布时间:2021-07-06
 截至2014年湖南省建筑施工企业个数和平均人数该数据包含了截至2014年湖南省建筑施工企业个数和平均人数。2000年总计为1812。2014年发布时间:2021-07-05
 截至2013年湖南省建筑施工企业个数和平均人数该数据包含了截至2013年湖南省建筑施工企业个数和平均人数。2000年总计为1812。2013年发布时间:2021-07-05
 截至2015年湖南省建筑施工企业个数和平均人数该数据包含了截至2015年湖南省建筑施工企业个数和平均人数。2000年总计为1812。2015年发布时间:2021-06-29
 截至2016年湖南省建筑施工企业个数和平均人数该数据包含了截至2016年湖南省建筑施工企业个数和平均人数。2000年总计为1812。2016年发布时间:2021-06-25
 截至2017年湖南省建筑施工企业个数和平均人数该数据包含了截至2017年湖南省建筑施工企业个数和平均人数。2000年总计为1812。2017年发布时间:2021-06-22
 截至2018年湖南省建筑施工企业个数和平均人数该数据包含了截至2018年湖南省建筑施工企业个数和平均人数。2000年总计为1812。2018年发布时间:2021-06-21
 截至2019年湖南省建筑施工企业个数和平均人数该数据包含了截至2019年湖南省建筑施工企业个数和平均人数。2000年总计为1812。2019年发布时间:2021-06-18
 截至2020年湖南省建筑施工企业个数和平均人数该数据包含了截至2020年湖南省建筑施工企业个数和平均人数。2000年总计为1812。2020年发布时间:2021-06-17
 截至2020年天津市和平区基本情况该数据包含了截至2020年天津市和平区基本情况。常住人口2019为33.0万人。2020年发布时间:2022-06-27
 2009-2018年全球183个国家和地区来自世界卫生组织(WHO)的净官方流量(现价美元)该数据包含了2009-2018年全球183个国家和地区来自世界卫生组织(WHO)的净官方流量(现价美元)。阿拉伯联盟国家2018年为28297838.98592(现价美元),2017年为21585463.1364345(现价美元),2016年为15165419.3103313(现价美元),2015年为21902092.6505327(现价美元),2014年为12811112.7018929(现价美元)。2009-2018年发布时间:2020-11-13


