"世界传媒年鉴"相关数据
更新时间:2024-10-142019世界能源统计年鉴
In particular,the data compiled in this year's Review suggest that in 2018,global energy demand and carbon emissions from energy use grew at their fastest rate since 2010/11,moving even fur ther away from the accelerated transition envisaged by the Paris climate goals.
BP's economics team estimate that much of the rise in energy growth last year can be traced back to weather-related effects,as farmilies and businesses increased their demand for cooling and heating in response to an unusually large number of hot and cold days.The acceleration in carbon emissions was the direct result of this increased energy consumption.
Even if these weather effects are short-lived,such that the growth in energy demand and carbon emissions slow over the next few years,there seems lttle doubt that the current pace of progress is inconsistent with the Paris climate goals.The world is on an unsustainable path:the longer carbon emissions continue to rise,the harder and more costly will be the eventual adjustment to net-zero carbon emissions.Yet another year of growing carbon emissions underscores the urgency for the world to change.
The Statistical Review provides a timely and objective insight into those developments and how that change can begin to be achieved.
The strength iท energy consumption was reflected acroรs all the fuels,many of which grew more strongly than their recent historical averages.This acceleration was particularly pronounced for natural gas,which grew at one of its fastest rates for over 30 years,accounting for over 40% of the growth in primary energy.On the supply side,the data for 2018 reinforced the central importance of the US shale revolution.
【更多详情,请下载:2019世界能源统计年鉴】
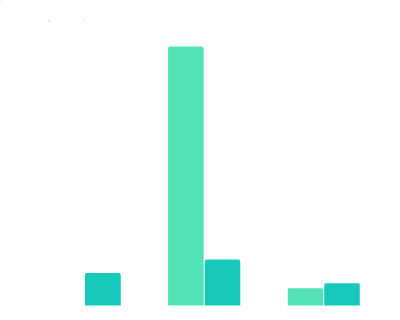
 2007-2014年华视传媒租金营收占比情况该统计数据包含了2007-2014年华视传媒租金营收占比情况。其中2012年占比最高达83.9%。2007-2014年发布时间:2020-10-21
 2010及2012年华视传媒商誉减值情况(单位:百万美元)该统计数据包含了2010及2012年华视传媒商誉减值情况(单位:百万美元)。2012年无形资产商誉减值损失达178.81百万美元。2010-2012年发布时间:2020-10-21
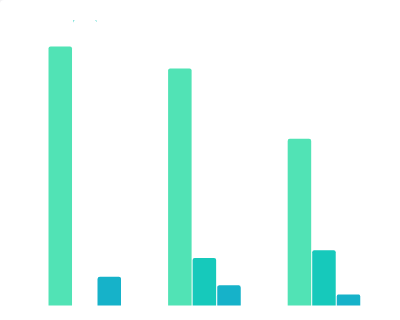
 2007-2014年华视传媒历年营收增速及净利润率该统计数据包含了2007-2014年华视传媒历年营收增速及净利润率。华视传媒营收增速逐年降低,2017年增速达-0.9%。2007-2014年发布时间:2020-10-21
 2006-2014年航美传媒历年各项主要成本变化情况该统计数据包含了2006-2014年航美传媒历年各项主要成本变化情况。航美传媒的点位租金/营业成本占比稳定在65%-75%区间内,租金/营业净收入占比由2010年的58.26%稳步升至 2014年的69.59%,表明特许经营费所驱动的创收边际能力下降。2006-2014年发布时间:2020-10-21
 1960-2017年世界主要国家GDP占世界比重的历史变化情况该统计数据包含了1960-2017年世界主要国家GDP占世界比重的历史变化情况。2017年中国GDP占世界比重为15.2%。1960-2017年发布时间:2019-07-11
 2012-2017年分众传媒ROE的情况该统计数据包含了2012-2017年分众传媒ROE的情况。2017年分众传媒净资产收益率为57.9%。2012-2017年发布时间:2019-08-13
 2006-2014年航美传媒历年特许经营费占比变化情况该统计数据包含了2006-2014年航美传媒历年特许经营费占比变化情况。航美传媒的点位租金/营业成本占比稳定在65%-75%区间内,租金/营业净收入占比由2010年的58.26%稳步升至 2014年的69.59%,表明特许经营费所驱动的创收边际能力下降。2006-2014年发布时间:2020-10-21
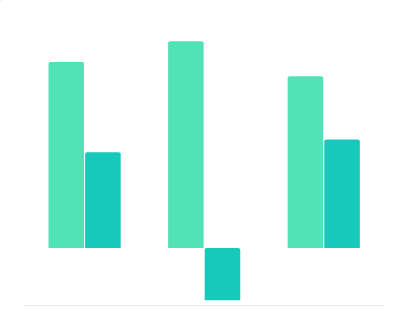 2006-2014年航美传媒历年毛利率、净利率变化情况该统计数据包含了2006-2014年航美传媒历年毛利率、净利率变化情况。航美传媒的综合业务毛利率、净利率在 2008-2009 年间迅速下滑,2011-2014年间平均毛利率在10%左右,净利率在-7%。2006-2014年发布时间:2020-10-21
 2006-2014年航美传媒机场广告各细分项目历年创收情况该统计数据包含了2006-2014年航美传媒机场广告各细分项目历年创收情况。其中机场数字框架营业收入表现最佳,占比最高。2006-2014年发布时间:2020-10-21
 2006-2014年中国航美传媒机场广告各细分项目单位售价该统计数据包含了2006-2014年航美传媒机场广告各细分项目单位售价。2012年飞机内数字屏幕广告平均售价最高为34074美元。2006-2014年发布时间:2020-10-21
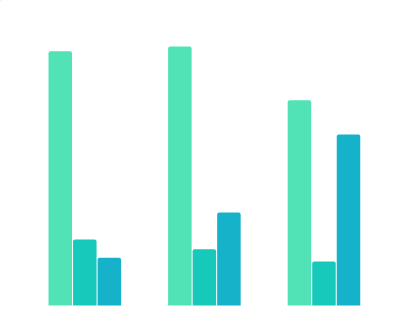 1990-2017年世界主要国家基于PPP的GDP占世界比重的历史变化情况该统计数据包含了1990-2017年世界主要国家基于PPP的GDP占世界比重的历史变化情况。2017年美国基于PPP的GDP占世界比重为15.2%。1990-2017年发布时间:2019-07-11
 2012-2017年分众传媒楼宇媒体收入的情况该数据包含了2012-2017年分众传媒楼宇媒体收入的情况。2017收入为93.83亿元。2012-2017年发布时间:2019-08-13
 2012-2018年分众传媒楼宇媒体总点位数的情况该统计数据包含了2012-2018年分众传媒楼宇媒体总点位数的情况。2018年分众传媒楼宇媒体总点位数为216.7万。2012-2018年发布时间:2019-08-13
 2006-2014年航美传媒历年各细分机场广告点位售卖率变化该统计数据包含了2006-2014年航美传媒历年各细分机场广告点位售卖率变化。2010年飞机内数字屏幕广告售卖率最高达73.1%。2006-2014年发布时间:2020-10-21
 2013-2017年中国分众传媒楼宇媒体收入的增速情况该数据包含了2013-2017年分众传媒楼宇媒体收入的增速情况。2016增速为16.5%。2013-2017年发布时间:2019-08-26
 2006-2014年航美传媒机场广告历年营收及同比增速该统计数据包含了2006-2014年航美传媒机场广告历年营收及同比增速。2007-2008 年分别同比增长 130.79%和187.86%;随后的 2009-2011 年,受制于机场广告行业景气度影响营收增速持续下滑,自2013 年起,航美传媒的机场广告收入出现负增长。2006-2014年发布时间:2020-10-21
 2012-2018H1中国分众传媒影屏幕数量变化情况该数据包含了2012-2018H1中国分众传媒影屏幕数量变化情况。2018H1影院数量为1900家,银幕数量为12600个。2012-2018年发布时间:2019-09-12
 2012-2018年分众传媒楼宇媒体总点位数增速的情况该数据包含了2012-2018年分众传媒楼宇媒体总点位数增速的情况。2014增速为28%。2012-2018年发布时间:2019-08-13
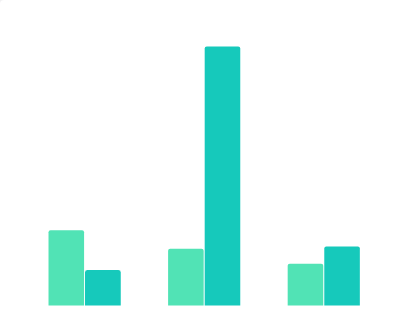 2006-2014年航美传媒历年销售费用率、管理费用率变化情况该统计数据包含了2006-2014年航美传媒历年销售费用率、管理费用率变化情况。航美传媒自2009年后进入稳态的销售控费阶段,期间销售费用率在9%左右附近波动。2006-2014年发布时间:2020-10-21
 2012-2018年分众传媒楼宇媒体广告的毛利率情况该统计数据包含了2012-2018年分众传媒楼宇媒体广告的毛利率情况。2018年分众传媒楼宇媒体广告的毛利率情况为69.2%。2012-2018年发布时间:2019-08-13


