"蒲城县2019统计年鉴"相关数据
更新时间:2024-11-222019世界能源统计年鉴
In particular,the data compiled in this year's Review suggest that in 2018,global energy demand and carbon emissions from energy use grew at their fastest rate since 2010/11,moving even fur ther away from the accelerated transition envisaged by the Paris climate goals.
BP's economics team estimate that much of the rise in energy growth last year can be traced back to weather-related effects,as farmilies and businesses increased their demand for cooling and heating in response to an unusually large number of hot and cold days.The acceleration in carbon emissions was the direct result of this increased energy consumption.
Even if these weather effects are short-lived,such that the growth in energy demand and carbon emissions slow over the next few years,there seems lttle doubt that the current pace of progress is inconsistent with the Paris climate goals.The world is on an unsustainable path:the longer carbon emissions continue to rise,the harder and more costly will be the eventual adjustment to net-zero carbon emissions.Yet another year of growing carbon emissions underscores the urgency for the world to change.
The Statistical Review provides a timely and objective insight into those developments and how that change can begin to be achieved.
The strength iท energy consumption was reflected acroรs all the fuels,many of which grew more strongly than their recent historical averages.This acceleration was particularly pronounced for natural gas,which grew at one of its fastest rates for over 30 years,accounting for over 40% of the growth in primary energy.On the supply side,the data for 2018 reinforced the central importance of the US shale revolution.
【更多详情,请下载:2019世界能源统计年鉴】
 2020年中国贫困县建档立卡户享受帮扶政策情况该统计数据包含了2020年中国贫困县建档立卡户享受帮扶政策情况。享受过产业帮扶政策的家庭户数为1465.8万。2020年发布时间:2021-12-31
 2000-2011年中国开展精神病防治康复工作县(市、区)个数统计该统计数据包含了2000-2011年全国开展精神病防治康复工作县(市、区)个数统计。2011年全国开展精神病防治康复工作县(市、区)个数为2423个。2000-2011年发布时间:2020-05-12
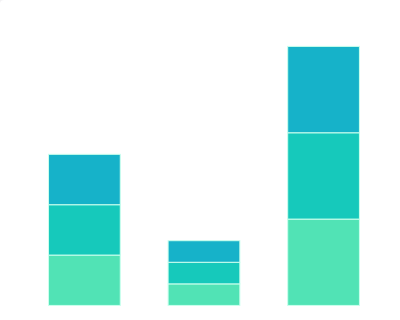 2000-2014年中国自治县数该统计数据包含了2000-2014年自治县数。2014年云南省的自治县数最多,有29个。2000-2014年发布时间:2018-11-23
 2019年中国各省文盲率统计该统计数据包含了2019年中国各省文盲率统计。其中,西藏文盲率高达30%。2019年发布时间:2020-12-18
 2009-2015年上海市崇明县公园数该数据包含了2009-2015年上海市崇明县公园数。2014公园数为3个。2009-2015年发布时间:2021-08-20
 2013-2015年上海市崇明县公园面积该数据包含了2013-2015年上海市崇明县公园面积。2014公园面积为25.61公顷。2013-2015年发布时间:2021-08-20
 2009-2015年上海市崇明县小学招生数该数据包含了2009-2015年上海市崇明县小学招生数。2012招生数为4433人。2009-2015年发布时间:2021-08-20
 2009-2015年上海市崇明县公园游园人数该数据包含了2009-2015年上海市崇明县公园游园人数。2015公园游园人数为51.9万人次。2009-2015年发布时间:2021-08-20
 2009-2015年上海市崇明县人口密度该数据包含了2009-2015年上海市崇明县人口密度。2011人口密度为612人/平方公里。2009-2015年发布时间:2021-08-20
 2009-2015年上海市崇明县户籍人口数该数据包含了2009-2015年上海市崇明县户籍人口数。2009人数为69.02万人。2009-2015年发布时间:2021-08-20
 2009-2015年上海市崇明县小学学校数该数据包含了2009-2015年上海市崇明县小学学校数。2009学校数为37所。2009-2015年发布时间:2021-08-20
 2009-2015年上海市崇明县高中招生数该数据包含了2009-2015年上海市崇明县高中招生数。2009招生数为3054人。2009-2015年发布时间:2021-08-20
 2009-2015年上海市崇明县初中招生数该数据包含了2009-2015年上海市崇明县初中招生数。2009招生数为3940人。2009-2015年发布时间:2021-08-20
 2009-2015年上海市崇明县绿地面积该数据包含了2009-2015年上海市崇明县绿地面积。2015绿地面积为27972.53公顷。2009-2015年发布时间:2021-08-20
 2009-2015年上海市崇明县年末常住人口该数据包含了2009-2015年上海市崇明县年末常住人口。2011年末常住人口为72.5万人。2009-2015年发布时间:2021-08-20
 2009-2013年上海市崇明县土地面积该数据包含了2009-2013年上海市崇明县土地面积。2009土地面积为1185.49平方公里。2009-2013年发布时间:2021-08-20
 2009-2015年上海市崇明县普通中学招生数该数据包含了2009-2015年上海市崇明县普通中学招生数。2009招生数为6994人。2009-2015年发布时间:2021-08-20
 2009-2015年上海市崇明县高中在校学生数该数据包含了2009-2015年上海市崇明县高中在校学生数。2009在校学生数为9820人。2009-2015年发布时间:2021-08-20
 2009-2015年上海市崇明县初中毕业生数该数据包含了2009-2015年上海市崇明县初中毕业生数。2009毕业生数为5218人。2009-2015年发布时间:2021-08-20
 2009-2015年上海市崇明县小学在校学生数该数据包含了2009-2015年上海市崇明县小学在校学生数。2011在校学生数为19301人。2009-2015年发布时间:2021-08-20


