"贫困率"相关数据
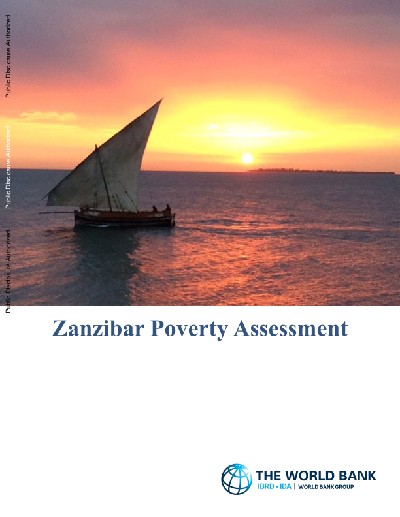
更新时间:2024-11-15桑给巴尔贫困评估
Glossary
Poverty headcount or monetary basic needs poverty rate: measures the proportion of the population whose monthly (price -adjusted) total household consumption per adult is below th national basic needs poverty line of TZS 53,377 (in 2014/15). Basic need poverty rates represent official national poverty levels.
Extreme poverty headcount: proportion of the population whose monthly (price-adjusted) total household consumption per adult is below the food poverty line. The extreme poor are unable to meet the minimum nutritional requirements of 2,200 kilocalories (kcal) per adult per day.
Poverty gap or depth of poverty: measures the distance between the average consumption of the poor and the poverty line.
Severity of poverty: estimates the inequality among the poor.
International poverty: proportion of the population whose daily total household consumption per person is below the international poverty line of US$1.90 per person per day (in the 2011 Purchasing Power Parity exchange rate).
Dimension-specific deprivation: proportion of households (or individuals) who suffer from a deprivation or a shortfall from a threshold on a specific dimension of well- being such as education, access to basic services, consumption and so forth. For example, water deprivation is measured by the proportion of households that lack access to safe (or improved) drinking water.
【更多详情,请下载:桑给巴尔贫困评估】
 1990-2017年美国的贫困率该统计数据包含了1990-2017年美国的贫困率。2017年美国的贫困率为12.3%。1990-2017年发布时间:2019-03-26
 2011-2015年中国60岁以上老人基于消费的贫困率该统计数据包含了2011-2015年中国60岁以上老人基于消费的贫困率。其中2015年的贫困率为15.1%。2011-2015年发布时间:2021-06-16
 2011-2015年中国60岁以上老人基于消费的贫困率(分城乡户口)该统计数据包含了2011-2015年中国60岁以上老人基于消费的贫困率(分城乡户口)。其中2015年农业户口贫困率为19.7%。2011-2015年发布时间:2021-06-16
 2011-2015年中国60岁以上老人基于消费的贫困率(分城乡户口和年龄组)该统计数据包含了2011-2015年中国60岁以上老人基于消费的贫困率(分城乡户口和年龄组)。其中2015年农业户口75岁以上的贫困率为22.6%。2011-2015年发布时间:2021-06-16
 2015-2019年年末中国农村贫困人口和贫困发生率该数据包含了2015-2019年年末全国农村贫困人口和贫困发生率。2015贫困人口为5575万人,贫困发生率为5.7%。2015-2019年发布时间:2020-03-07
 2014-2018年年末中国中国农村贫困人口和贫困发生率该统计数据包含了2014-2018年年末中国全国农村贫困人口和贫困发生率。2014年农村贫困人口7017万人,贫困发生率7.2%。2014-2018年发布时间:2020-05-23
 2015-2019年中国农村贫困人口和贫困发生率该统计数据包含了2015-2019年中国农村贫困人口和贫困发生率。5年共计1.5亿人实现脱贫。2015-2019年发布时间:2020-05-21
 2013-2017年中国贫困地区基础设施条件该统计数据包含了2013-2017年中国贫困地区基础设施条件。2017年中国贫困地区主干道路面经过硬化处理的自然村比重为81.8%,通客运车的自然村比重为51.2%。2013-2017年发布时间:2020-06-10
 2012-2018年中国农村脱贫人口与贫困发生率情况该统计数据包含了2012-2018年中国农村脱贫人口与贫困发生率情况。2018年中国农村脱贫人口、贫困发生率分别为1660万人、1.7%。2012-2018年发布时间:2019-09-12
 2013-2017年中国贫困地区通客运班车的自然村比重情况该统计数据包含了2013-2017年中国贫困地区通客运班车的自然村比重情况。2017年贫困地区通客运班车的自然村比重占51.2%。2013-2017年发布时间:2020-05-23
 2013-2017年中国贫困地区主干道路面经过硬化处理的自然村比重情况该统计数据包含了2013-2017年中国贫困地区主干道路面经过硬化处理的自然村比重情况。2017年贫困地区主干道路面经过硬化处理的自然村比重达81.1%。2013-2017年发布时间:2020-05-23
 2011-2019年中国贫困标准线变化该统计数据包含了2011-2019年中国贫困标准线变化。其中2019年贫困地区人均可支配收入为3200元。2011-2019年发布时间:2021-07-21
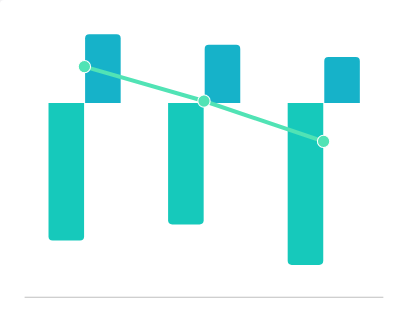 2013-2019年中国农村贫困人口变化该统计数据包含了2013-2019年中国农村贫困人口变化。其中2019年农村贫困人口为551万人。2013-2019年发布时间:2021-07-21
 2004-2015年英国贫困差距,按每天1.90美元衡量(2011PPP)该数据包含了2004-2015年贫困差距,按每天1.90美元衡量的(2011 PPP)(百分比)(英国)。2005百分比为0.3%。2004-2015年发布时间:2019-09-04
 2003-2015年西班牙贫困差距,按每天1.90美元衡量(2011PPP)该数据包含了2003-2015年贫困差距,按每天1.90美元衡量的(2011 PPP)(百分比)(西班牙)。2011百分比为0.9%。2003-2015年发布时间:2019-09-04
 2003-2015年挪威贫困差距,按每天1.90美元衡量(2011PPP)该数据包含了2003-2015年贫困差距,按每天1.90美元衡量的(2011 PPP)(百分比)(挪威)。2004百分比为0.2%。2003-2015年发布时间:2019-09-04
 2003-2014年意大利贫困差距,按每天1.90美元衡量(2011PPP)该数据包含了2003-2014年贫困差距,按每天1.90美元衡量的(2011 PPP)(百分比)(意大利)。2013百分比为1.1%。2003-2014年发布时间:2019-09-04
 1984-2016年墨西哥贫困差距,按每天1.90美元衡量(2011PPP)该数据包含了1984-2016年贫困差距,按每天1.90美元衡量的(2011 PPP)(百分比)(墨西哥)。1998百分比为3.6%。1984-2016年发布时间:2019-09-04
 1981-2015年巴西贫困差距,按每天1.90美元衡量(2011PPP)该数据包含了1981-2015年贫困差距,按每天1.90美元衡量的(2011 PPP)(百分比)(巴西)。1983百分比为11.3%。1981-2015年发布时间:2019-09-04
 1977-2011年印度贫困差距,按每天1.90美元衡量(2011PPP)该数据包含了1977-2011年贫困差距,按每天1.90美元衡量的(2011 PPP)(百分比)(印度)。1977百分比为20.2%。1977-2011年发布时间:2019-09-04


