"论文引用年鉴"相关数据
更新时间:2024-10-112019世界能源统计年鉴
In particular,the data compiled in this year's Review suggest that in 2018,global energy demand and carbon emissions from energy use grew at their fastest rate since 2010/11,moving even fur ther away from the accelerated transition envisaged by the Paris climate goals.
BP's economics team estimate that much of the rise in energy growth last year can be traced back to weather-related effects,as farmilies and businesses increased their demand for cooling and heating in response to an unusually large number of hot and cold days.The acceleration in carbon emissions was the direct result of this increased energy consumption.
Even if these weather effects are short-lived,such that the growth in energy demand and carbon emissions slow over the next few years,there seems lttle doubt that the current pace of progress is inconsistent with the Paris climate goals.The world is on an unsustainable path:the longer carbon emissions continue to rise,the harder and more costly will be the eventual adjustment to net-zero carbon emissions.Yet another year of growing carbon emissions underscores the urgency for the world to change.
The Statistical Review provides a timely and objective insight into those developments and how that change can begin to be achieved.
The strength iท energy consumption was reflected acroรs all the fuels,many of which grew more strongly than their recent historical averages.This acceleration was particularly pronounced for natural gas,which grew at one of its fastest rates for over 30 years,accounting for over 40% of the growth in primary energy.On the supply side,the data for 2018 reinforced the central importance of the US shale revolution.
【更多详情,请下载:2019世界能源统计年鉴】
 2011年按ESI论文被引用次数排序的前20个国家该统计数据包含了2011年按ESI论文被引用次数排序的前20个国家。2011年中国ESI论文被引用次数排名第七,被引用836255次。2011年发布时间:2018-11-26
 2010-2016年中国知网和万方收录部分高校硕士论文数量该统计数据包含了2010-2016年中国知网和万方收录部分高校硕士论文数量。和第自2010至2016年间,清华大学和北京大学被收录论文分别为5922篇和15644篇,排名第28和第22.2010-2016年发布时间:2019-06-11
 2011年按ESI论文数量排序的前20个国家该统计数据包含了2011年按ESI论文数量排序的前20个国家。2011年,中国论文数量排名第二,共计836255篇,论文引用率为6.21次/篇。2011年发布时间:2018-11-26
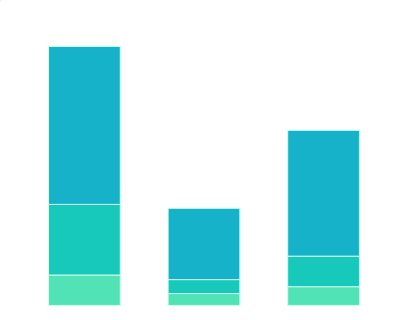 1995-2010年国外主要检索工具收录我国论文总数及在世界上的位置(收录论文数)该统计数据包含了1995-2010年国外主要检索工具收录我国论文总数及在世界上的位置(收录论文数)。2010年《Science Citation Index》收录我国论文总数为143769篇。1995-2010年发布时间:2018-11-26
 2011-2016年中国SCI收录中国科技论文篇数情况该统计数据包含了2011-2016年中国SCI收录我国科技论文篇数情况。2016年中国SCI收录生物学、临床医学、基础医学、药学论文分别为34657篇、32109篇、19260篇、8839篇。2011-2016年发布时间:2019-07-11
 截至2018年12月31日94所中国AI大学发表国际论文数TOP30高校论文数占比情况该统计数据包含了截至2018年12月31日94所中国AI大学发表国际论文数TOP30高校论文数占比情况。截至2018年12月31日清华大学发表国际论文数占比为4.12%。2018年发布时间:2020-05-09
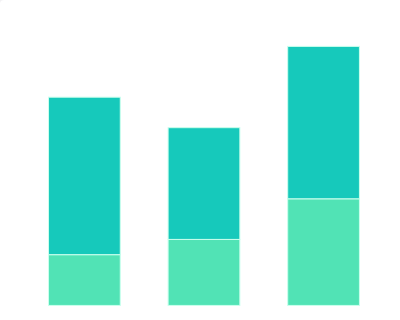 2018年国际期刊论文总量比例情况该统计数据包含了2018年国际期刊论文总量比例情况。中国语音交互占比10%。2018年发布时间:2019-07-11
 2019年中国抖音母婴人群对各类型POI引用占比情况该统计数据包含了2019年中国抖音母婴人群对各类型POI引用占比情况。风景名胜占比最高,占比29.22%。2019年发布时间:2020-07-16
 2018年中国期刊论文总量情况该统计数据包含了2018年中国期刊论文总量情况。深度学习发文数量41840篇。2018年发布时间:2019-07-11
 2019年中国消费金融产品吸引用户选购因素分布情况该数据包含了2019年中国消费金融产品吸引用户选购因素分布情况。产品知名度占比为39.5%。2019年发布时间:2019-12-23
 2017年中国国内论文的机构类型分布该统计数据包含了2017年中国国内论文的机构类型分布。其中,高等院校占比最高为66.0%。2017年发布时间:2020-04-26
 1995-2008年中国发表科技论文数该数据包含了1995-2008年发表科技论文。2014数值为157单位:万篇。1995-2008年发布时间:2018-11-23
 2018年中国会议论文总量情况该数据包含了2018年中国会议论文总量情况。深度学习发文数量为27035篇。2018年发布时间:2019-07-11
 2017年SCI收录中国论文最多的学科TOP10该统计数据包含了2017年SCI收录中国论文最多的学科TOP10。其中,化学论文的数量仍居众学科之首,达到5.1万篇。2017年发布时间:2020-04-26
 2010-2015年中国教育部授予硕士学位数量与两大数据库收录硕士论文数量对比该统计数据包含了2010-2015年教育部授予硕士学位数量与两大数据库收录硕士论文数量对比。2015年教育部授予硕士学位497744个,中国知网数据库收录硕士论文286729篇,万方收录247628个。2010-2015年发布时间:2019-06-11
 2000-2017年SCI收录中国论文数占世界总量比重该统计数据包含了2000-2017年SCI收录中国论文数占世界总量比重。其中,2017年SCI收录中国论文数占世界总量比重为18.6%。2000-2017年发布时间:2020-04-26
 2021年中国不同类型合同纠纷引用绿色原则的案件数量该统计数据包含了2021年中国不同类型合同纠纷引用绿色原则的案件数量。买卖合同引用绿色原则的案件数最高,案件数61件。2021年发布时间:2022-08-30
 2021年中国餐企吸引用户进入私域流量池的主要手段该统计数据包含了2021年中国餐企吸引用户进入私域流量池的主要手段。其中通过优惠折扣和权益吸引用户的占比59.3%。2021年发布时间:2021-12-31
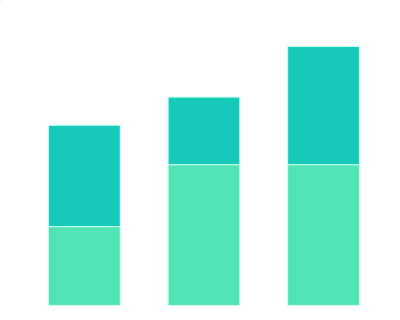 2018年全球国际会议论文总量比例情况该数据包含了2018年国际会议论文总量比例情况。文本处理中国为25%,美国为12%。2018年发布时间:2019-07-11
 2021年中国法院认定和裁判部分引用绿色原则的合同类型分布该统计数据包含了2021年中国法院认定和裁判部分引用绿色原则的合同类型分布。租赁合同的占比最高,占比26.67%。2021年发布时间:2022-08-30


