"金蝶2021半年财报"相关数据
更新时间:2024-11-21“We are proud to announce another stellar quarter of quality growth," said Mr. Rui Chen, the chairman of the board and chief executive officer of Bilibili.“During our peak summer season, user growth surged, engagement levels reached an all-time high, and we continued to expand our topline. In the third quarter, MAUs and DAUs each grew 35% year-over-year, advancing us toward our 3-year growth goal. Importantly, our community is stickier and more engaged than ever. Users spent an average of 88 minutes per day on Bilibili, the longest time we have seen in our operating history. Along with our growth, we are deepening our commitment as a responsible public company. We continue to cultivate an inclusive community; promoting positive content and engaging in better environmental, social and governance practices. We hope to instill heartening Chinese culture and values across our community, and bring more‘Created in-China' content to the world" Mr. Sam Fan, chief financial officer of Bilibi, said,“We closed the third quarter with record high revenues of RMB5.2 billion, up 61% year-over-year. Our revenue mix is more balanced and healthier, and we continue to improve monetization across our growing businesses. Motivated by our expansive brand influence, revenues from our advertising business continued to increase, up 110% in the third quarter to RMB1.2 billion, compared with the same period in 2020. MPUs also grew to 24 million in the third quarter, up 59% year-over- year, and our paying ratio reached 8 9%. We believe we are on the right path to achieve our near- and long- term goals, fortified by our strong fundamentals, healthy balance sheet and ample cash reserves of RMB24.4 billion.Total net revenues. Total net revenues were RMB5,206.6 million (USS808.0 million), representing an increase of 61% from the same period of 2020. Mobile games. Revenues from mobile games were RMB1 ,391.7 million (US$216.0 million), representing an increase of 9% from the same period of 2020. Value-added services (VAS). Revenues from VAS were RMB1 ,908 9 million (USS296.3 million), representing an increase of 95% from the same period of 2020, mainly attributable to the Company' s enhanced monetization efforts, led by an increased number of paying users for the Company' s value- added services including the premium membership program, live broadcasting services and other value-added services. Advertising. Revenues from advertising were RMB1,172.0 million (USS181.9 million), representing an increase
of 110% from the same period of 2020. This increase was primarily attributable to further recognition of Bilibili's brand name in China' s online advertising market, as well as Bilibili' s improved advertising efficiency.
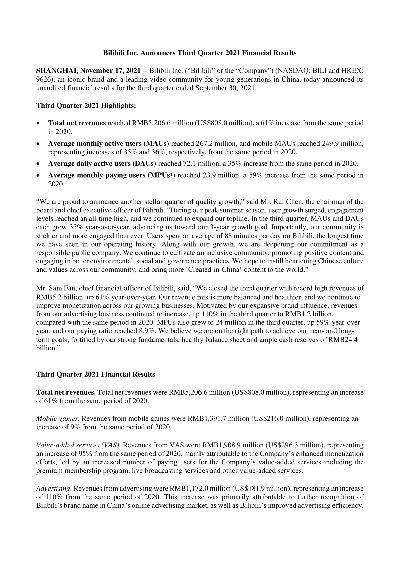
 2016-2018年中国金蝶营业收入构成及增长情况该统计数据包含了2016-2018年中国金蝶营业收入构成及增长情况。其中,2016年云服务收入为3.4亿元。2016-2018年发布时间:2021-03-03
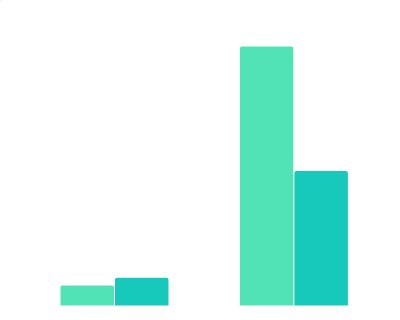 2017年和2021年中国用友网络和金蝶国际云服务收入该统计数据包含了2017年和2021年中国用友网络和金蝶国际云服务收入。2021年用友网络云服务收入达到了53.2亿元。2017-2021年发布时间:2022-08-26
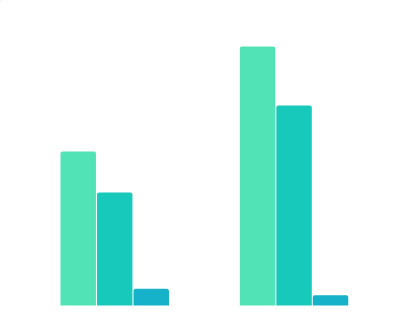 2020年-2021年H1雍禾医疗财报主要经营数据该统计数据包含了2020年-2021年H1雍禾医疗财报主要经营数据。数据显示,2021年上半年雍禾医疗营收超过10亿元,毛利达7.8亿元但净利润仅为0.4亿元。2020-2021年发布时间:2021-12-15
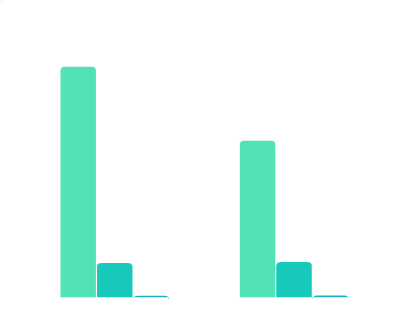 2020-2021年前三季度华为财报主要数据该统计数据包含了2020-2021年前三季度华为财报主要数据。数据显示,华为2021年前三季度销售收入4558亿元,同比减少三成,但期间净利润未出现同步下滑。2020-2021年发布时间:2021-11-01
 2016-2018年中国新氧财报情况该统计数据包含了2016-2018年中国新氧财报情况。2018年总营收最高,总营收61.7千万。2016-2018年发布时间:2020-07-22
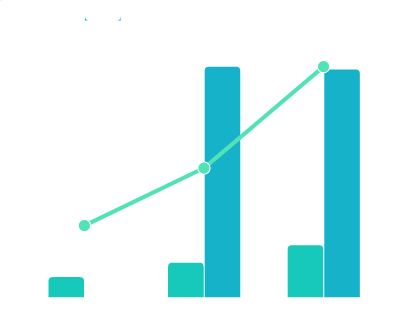 2014-2018年金蝶国际云收入情况该统计数据包含了2014-2018年金蝶国际云收入情况。2018年金蝶国际元业务收入为3.55亿元,云业务占比28%,云业务同比26%。2014-2018年发布时间:2019-09-26
 2021年上半年中国广告主行业投放费用Top10该统计数据包含了2021年上半年中国广告主行业投放费用Top10。2021年中国互联网媒介投放广告市场规模接近1600亿元,投入费用排在首位的广告主行业是网络购物,为222.3亿元。2021年发布时间:2021-10-25
 2021年上半年“蔚小理”销冠产品该统计数据包含了2021年上半年“蔚小理”销冠产品。“蔚小理”2021年上半年销冠产品,理想ONE销量30154万辆,超过小鹏P7的19496万辆和蔚来ES6的18023万辆。2021年发布时间:2021-09-14
 2019-2021年上半年中国全行业的涨薪率情况该统计数据包含了2019-2021年上半年中国全行业的涨薪率情况。其中2021Q2涨薪率为9.68%。2019-2021年发布时间:2021-09-24
 2019-2021年上半年中国金融行业涨薪率情况该统计数据包含了2019-2021年上半年中国金融行业涨薪率情况。其中2021Q2涨薪率为12.46%。2019-2021年发布时间:2021-09-24
 2016年中国网络消费规模指数和水平指数的同比与财新PMI的同比相关关系检验该统计数据包含了2016年中国网络消费规模指数和水平指数的同比与财新PMI的同比相关关系检验。其中PMI同比未来4期网络消费规模指数_SA同比为0.40。2016年发布时间:2021-02-05
 2019到2021年上半年中国互联网行业涨薪率情况该统计数据包含了2019到2021年上半年中国互联网行业涨薪率情况。其中2021Q2涨薪率为9.71%。2019-2021年发布时间:2021-09-24
 2019年-2021年中国医疗服务上市公司的财报数据该统计数据包含了2019年-2021年中国医疗服务上市公司的财报数据。爱尔眼科2020年中报的收入最高,收入11912409985元。2019-2021年发布时间:2022-10-27
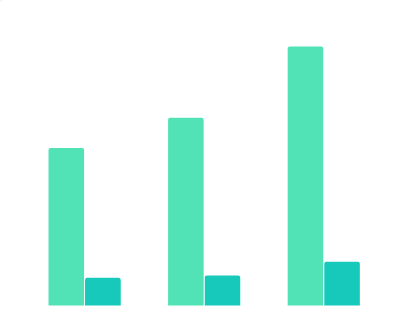 2016-2018财年NASPERS财务表现情况该数据包含了2016-2018财年NASPERS财务表现情况。2018营收为201亿美元,利润为34亿美元。2016-2018年发布时间:2019-12-12
 2018财年NASPERS营收分布情况该数据包含了2018财年NASPERS营收分布情况。社交及互联网平台占比为62%。2018年发布时间:2019-12-12
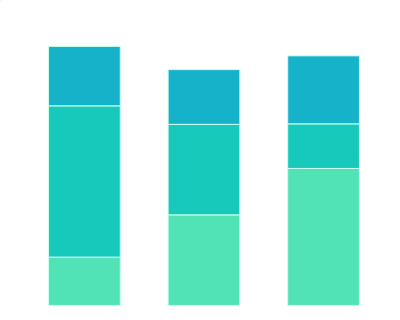 2021年上半年中国重点行业广告主投放移动广告类型占比该统计数据包含了2021年上半年中国重点行业广告主投放移动广告类型占比。其中,图片类广告仍然是首选,大部分行业中,竖屏视频甚至不如横屏视频受欢迎。2021年发布时间:2021-07-22
 2021年中国企业业财一体化程度及数据衔接性分布该统计数据包含了2021年中国企业业财一体化程度及数据衔接性分布。业财一体化程度一般,部分业务数据能与财务系统对接的占比最高,占比46.0%。2021年发布时间:2022-08-30
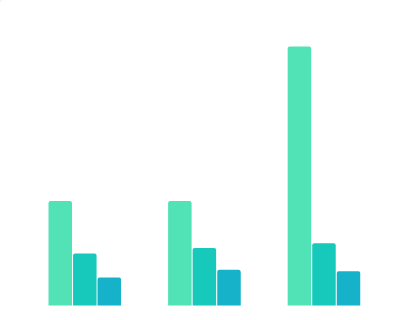 2020财年第三财季至2021财年第三财季苹果公司按产品类别划分净销售额该统计数据包含了2020财年第三财季至2021财年第三财季苹果公司按产品类别划分净销售额。苹果公司2021财年第三财季净营收中iPhone带来的营收为395.7亿美元。2020-2021年发布时间:2021-08-03
 2015年-2018年中国康得新公司利润造假情况该统计数据包含了2015年-2018年中国康得新公司利润造假情况。其中,2018年,康得新虚增利润占披露利润比例达到了711.29%。2015-2018年发布时间:2021-02-03
 2021年第三财季至2022年第三财季星巴克Starbucks美国区和中国区收入占总收入比重变化该统计数据包含了2021年第三财季至2022年第三财季星巴克Starbucks美国区和中国区收入占总收入比重变化。2022年第三财季美国区贡献收入占比69%,中国区贡献收入占比6.7%。2021-2022年发布时间:2022-08-05


