"公司新财报"相关数据
更新时间:2024-11-21BEIJING, Nov. 19, 2021 (GLOBE NEWSWIRE) - So-Young Intemnational Inc. (Nasdaq: SY) ("So-Young" or the“Company"), the largest and most vibrant social community in China for consumers, professionals and service providers in the medical aesthetics industry, today announced its unaudited financial results for the third quarter ended September 30, 2021. Third Quarter 2021 Financial Highlights Total revenues were RMB431 5 millin (US$67.0 million1), an increase of 20 0% from RMB359.6 million in the same period of 2020, in line with our previous guidance . Net income attributable to So-Young International Inc. was RMB68 million (US$1.1 million), an increase of 649.5% from RMB0.9 million in the third quarter of 2020 . Non-GAAP net income atributable to So-Young International Inc.2 was RMB28 9 million (US$4. 5 million), an increase of 9. 6% from RMB26 4 million in the third quarter of 2020. Third Quarter 2021 Operational Highlights , Average mobile MAUs were 8.0 million, compared with 8.7 million in the third quarter of 2020. Number of paying medical service providers on So-Young's platform were 4,841, an increase of 18.2% from 4,096 in the third quarter of 2020. Number of medical service providers subscribing to information services on So-Young's platform were 2,242, compared with 2, 146 in the third quarter of 2020. Total number of users purchasing reservation services were 174 2 thousand and the aggregate value of medical aesthetic treatment transactions facilitated by So-Young's platform was RMB755 4 million.
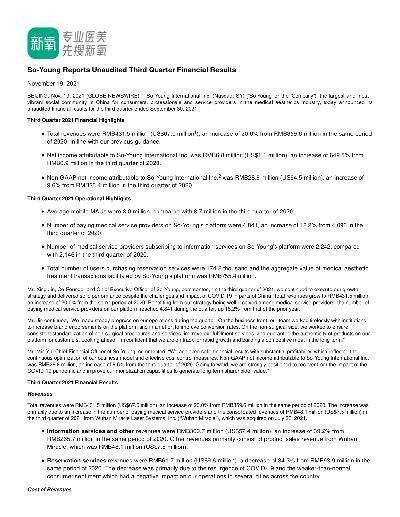
 2016-2018年中国新氧财报情况该统计数据包含了2016-2018年中国新氧财报情况。2018年总营收最高,总营收61.7千万。2016-2018年发布时间:2020-07-22
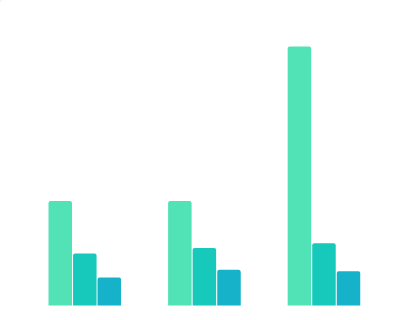 2020财年第三财季至2021财年第三财季苹果公司按产品类别划分净销售额该统计数据包含了2020财年第三财季至2021财年第三财季苹果公司按产品类别划分净销售额。苹果公司2021财年第三财季净营收中iPhone带来的营收为395.7亿美元。2020-2021年发布时间:2021-08-03
 2015年-2018年中国康得新公司利润造假情况该统计数据包含了2015年-2018年中国康得新公司利润造假情况。其中,2018年,康得新虚增利润占披露利润比例达到了711.29%。2015-2018年发布时间:2021-02-03
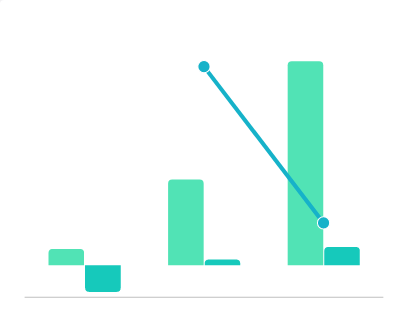 2016-2018年新氧公司营收规模该统计数据包含了2016-2018年新氧公司营收规模。2018年新氧公司营收规模为6.17亿元,净利润为0.55亿元。2016-2018年发布时间:2020-04-16
 2016年中国网络消费规模指数和水平指数的同比与财新PMI的同比相关关系检验该统计数据包含了2016年中国网络消费规模指数和水平指数的同比与财新PMI的同比相关关系检验。其中PMI同比未来4期网络消费规模指数_SA同比为0.40。2016年发布时间:2021-02-05
 2016-2019年中国新希望公司市盈率的情况该数据包含了2016-2019年中国新希望公司市盈率的情况。2018市盈率为17.8。2016-2019年发布时间:2019-10-16
 2016-2019年中国新希望公司市净率的情况该数据包含了2016-2019年中国新希望公司市净率的情况。2016市净率为1.5。2016-2019年发布时间:2019-10-16
 2016-2019年中国新希望公司每股净利润的情况该数据包含了2016-2019年中国新希望公司每股净利润的情况。2016净利润为0.59元。2016-2019年发布时间:2019-10-16
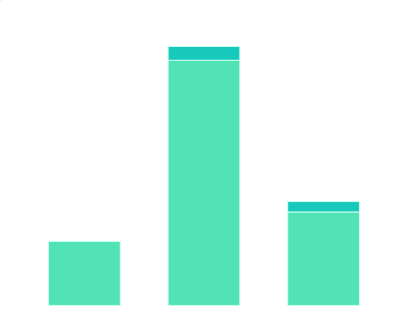 2021年中国公司新洋丰产能情况该统计数据包含了2021年中国公司新洋丰产能情况。其中磷肥设计产能为185万吨/年。2021年发布时间:2022-10-27
 2016-2019年中国新希望公司净资产收益率的情况该数据包含了2016-2019年中国新希望公司净资产收益率的情况。2016收益率为12.4%。2016-2019年发布时间:2019-10-16
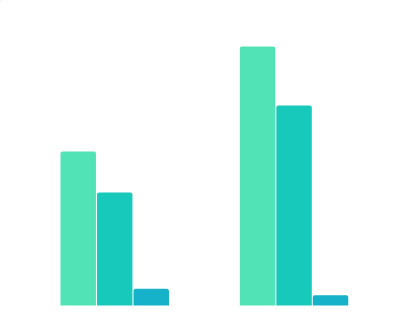 2020年-2021年H1雍禾医疗财报主要经营数据该统计数据包含了2020年-2021年H1雍禾医疗财报主要经营数据。数据显示,2021年上半年雍禾医疗营收超过10亿元,毛利达7.8亿元但净利润仅为0.4亿元。2020-2021年发布时间:2021-12-15
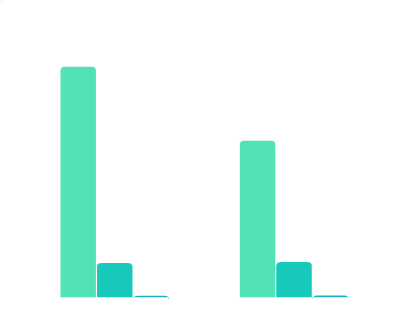 2020-2021年前三季度华为财报主要数据该统计数据包含了2020-2021年前三季度华为财报主要数据。数据显示,华为2021年前三季度销售收入4558亿元,同比减少三成,但期间净利润未出现同步下滑。2020-2021年发布时间:2021-11-01
 2017-2018年中国财险公司每股账面净值的情况该数据包含了2017-2018年中国财险公司每股账面净值的情况。2017净值为8.1元。2017-2018年发布时间:2019-10-16
 2019年-2021年中国医疗服务上市公司的财报数据该统计数据包含了2019年-2021年中国医疗服务上市公司的财报数据。爱尔眼科2020年中报的收入最高,收入11912409985元。2019-2021年发布时间:2022-10-27
 2012-2017年中国小型财险公司保费收入占比的情况本数据记录了2012年至2017年中国小型财险公司保费收入占比的情况,其中2017年小型财险公司保费收入占比达到了13.60%。2012-2017年发布时间:2020-02-26
 2012-2017年中国小型财险公司净利润占比的情况本数据记录了2012年至2017年中国小型财险公司净利润占比的情况,其中2017年小型财险公司净利润占比将达到-14.7%。2012-2017年发布时间:2020-02-26
 2009-2018年中国伟星新材公司加权ROE的情况该统计数据包含了2009-2018年中国伟星新材公司加权ROE的情况。2018年伟星新材公司加权ROE达到了29%。2009-2018年发布时间:2020-09-04
 2009-2018年中国伟星新材公司毛利率的情况该统计数据包含了2009-2018年中国伟星新材公司毛利率的情况。2018年伟星新材公司毛利率达到了47%。2009-2018年发布时间:2020-09-04
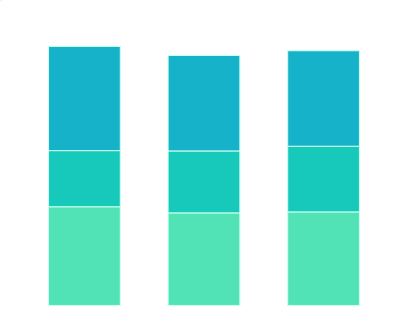 2018-2019年中国主要财险公司综合成本率该统计数据包含了2018-2019年中国主要财险公司综合成本率。2019H1人保财险综合赔付率为64.6%,太保财险综合费用率39.4%。2018-2019年发布时间:2020-04-16
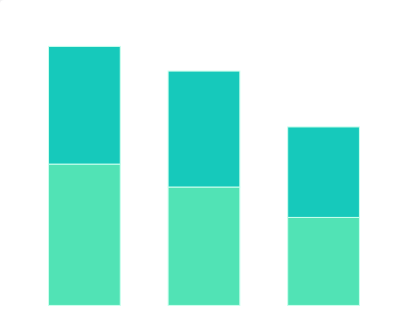 2020年中国新中产人群的上市公司股票、公募基金配置比例分布情况该统计数据包含了2020年中国新中产人群的上市公司股票、公募基金配置比例分布情况。上市公司股票的配置比例最高,占比68.47%。2020年发布时间:2021-04-16


