"公路货运量统计年鉴"相关数据
更新时间:2024-11-262019世界能源统计年鉴
In particular,the data compiled in this year's Review suggest that in 2018,global energy demand and carbon emissions from energy use grew at their fastest rate since 2010/11,moving even fur ther away from the accelerated transition envisaged by the Paris climate goals.
BP's economics team estimate that much of the rise in energy growth last year can be traced back to weather-related effects,as farmilies and businesses increased their demand for cooling and heating in response to an unusually large number of hot and cold days.The acceleration in carbon emissions was the direct result of this increased energy consumption.
Even if these weather effects are short-lived,such that the growth in energy demand and carbon emissions slow over the next few years,there seems lttle doubt that the current pace of progress is inconsistent with the Paris climate goals.The world is on an unsustainable path:the longer carbon emissions continue to rise,the harder and more costly will be the eventual adjustment to net-zero carbon emissions.Yet another year of growing carbon emissions underscores the urgency for the world to change.
The Statistical Review provides a timely and objective insight into those developments and how that change can begin to be achieved.
The strength iท energy consumption was reflected acroรs all the fuels,many of which grew more strongly than their recent historical averages.This acceleration was particularly pronounced for natural gas,which grew at one of its fastest rates for over 30 years,accounting for over 40% of the growth in primary energy.On the supply side,the data for 2018 reinforced the central importance of the US shale revolution.
【更多详情,请下载:2019世界能源统计年鉴】
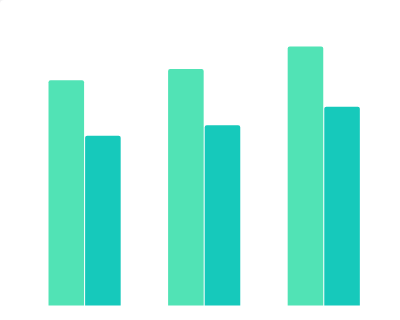 2015-2018年中国货运量、公路货运量该数据包含了2015-2018年全国货运量、公路货运量。2018货物运输量为514.6亿吨,公路运输量为395.9亿吨。2015-2018年发布时间:2020-05-30
 2017-2019年中国累计公路货运量该数据包含了2017-2019年全国累计公路货运量。2018-12公路货运量_累计为395.91亿吨,公路货运量_累计同比增速为7.38%。2017-2019年发布时间:2019-05-14
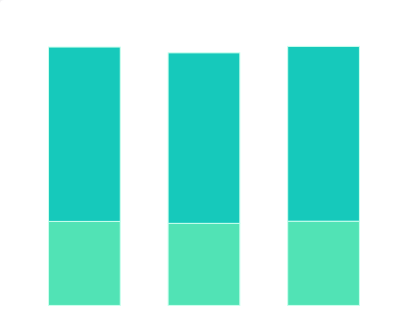 2017-2018年中国公路货运量情况该数据包含了2017-2018年中国公路货运量情况。11月2017为179285万吨,2018为372017万吨。2017-2018年发布时间:2019-10-30
 2017-2019年中国当期公路货运量该数据包含了2017-2019年全国当期公路货运量。2018-11公路货运量_当期为37.2亿吨,公路货运量_当期同比增速为5.7%。2017-2019年发布时间:2019-05-14
 2008-2018年中国公路货运量增速情况该数据包含了2008-2018年中国公路货运量增速情况。2011增速为15.05%。2008-2018年发布时间:2019-09-12
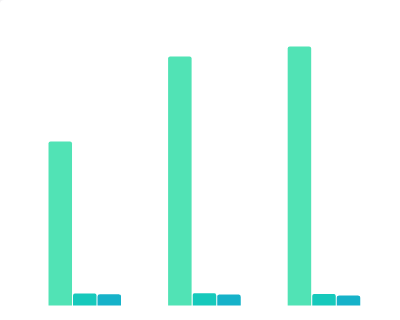 2012-2018年云南省货运量该数据包含了2012-2018年云南省货运量。2018货运量为140669.96万吨,铁路货运量为4661.03万吨,公路货运量为135321.43万吨,水运货运量为687.5万吨。2012-2018年发布时间:2021-11-12
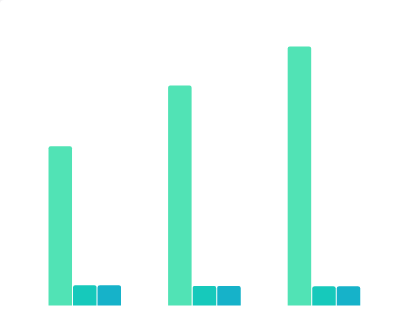 2012-2018年贵州省货运量该数据包含了2012-2018年贵州省货运量。2018货运量 为102536.67万吨,铁路货运量 为5512.67万吨,公路货运量 为95354万吨,水运货运量 为1670万吨。2012-2018年发布时间:2021-10-15
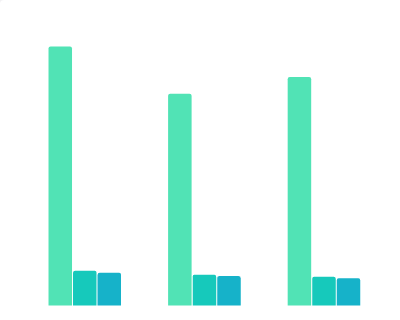 2012-2018年吉林省货运量该数据包含了2012-2018年吉林省货运量。2012货运量为54808.11万吨,铁路货运量为7347.11万吨,国家铁路货运量为6922.37万吨,地方铁路货运量为424.74万吨,公路货运量为47130万吨。2012-2018年发布时间:2021-09-08
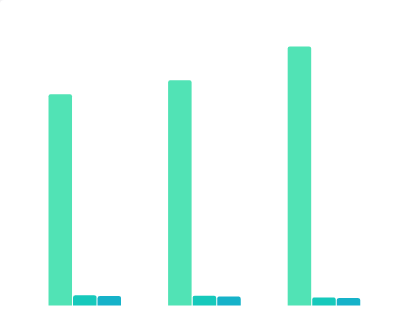 2012-2018年湖北省货运量该数据包含了2012-2018年湖北省货运量。2018货运量为204306.86万吨,铁路货运量为4729.88万吨,公路货运量为163144.98万吨,水运货运量为36431.98万吨。2012-2018年发布时间:2022-01-07
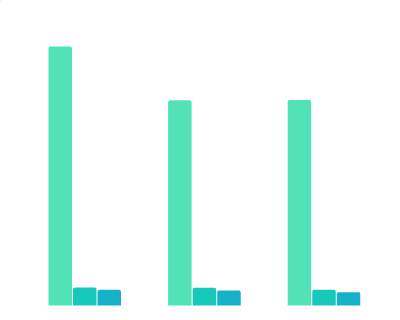 2012-2018年山东省货运量该数据包含了2012-2018年山东省货运量。2018货运量为354018.72万吨,铁路货运量为23247.07万吨,公路货运量为312807.32万吨,水运货运量为17964.33万吨。2012-2018年发布时间:2021-12-01
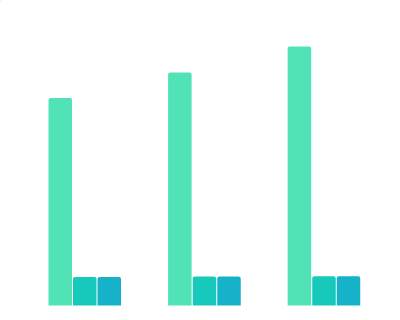 2012-2018年甘肃省货运量该数据包含了2012-2018年甘肃省货运量。2018货运量 为70385.7万吨,铁路货运量 为6086.83万吨,公路货运量 为64271.06万吨,水运货运量 为27.8万吨。2012-2018年发布时间:2021-10-13
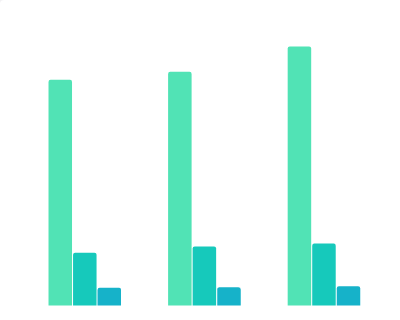 2012-2018年陕西省货运量该数据包含了2012-2018年陕西省货运量。2018货运量 为173245.46万吨,铁路货运量 为42245.46万吨,公路货运量 为130823万吨,水运货运量 为177万吨。2012-2018年发布时间:2021-10-13
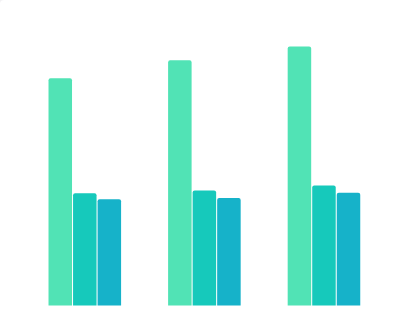 2012-2018年山西省货运量该数据包含了2012-2018年山西省货运量。2018货运量为211496.83万吨,铁路货运量为85260.09万吨,公路货运量为126213.59万吨,水运货运量为23.14万吨。2012-2018年发布时间:2021-09-10
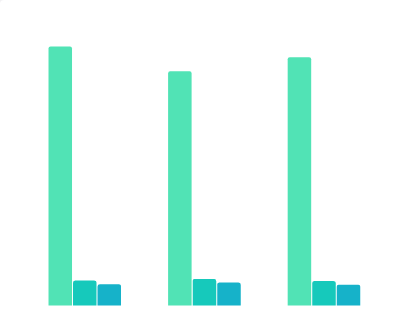 2012-2018年河北省货运量该数据包含了2012-2018年河北省货运量。2018货运量为249322.69万吨,铁路货运量为19637.33万吨,公路货运量为226333.56万吨,水运货运量为3351.79万吨。2012-2018年发布时间:2021-09-10
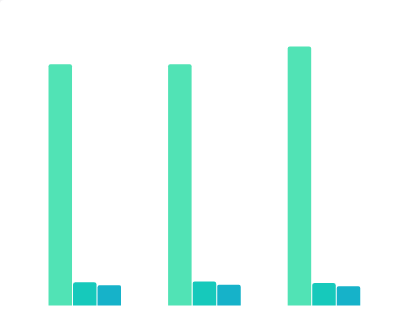 2012-2018年辽宁省货运量该数据包含了2012-2018年辽宁省货运量。2018货运量为223346.01万吨,铁路货运量为19691.25万吨,公路货运量为189737万吨,水运货运量为13917.76万吨。2012-2018年发布时间:2021-09-08
 2012-2018年河南省货运量该数据包含了2012-2018年河南省货运量。2012货运量为272114.94万吨,铁路货运量为12637.94万吨,国家铁路货运量为11423.66万吨,地方铁路货运量为910.82万吨,合资铁路货运量为303.45万吨。2012-2018年发布时间:2021-11-24
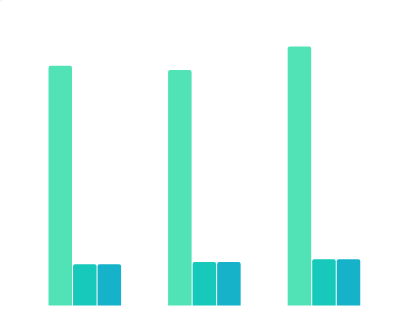 2012-2018年天津市货运量该数据包含了2012-2018年天津市货运量。2018货运量为52220.65万吨,铁路货运量为9248.56万吨,公路货运量为34711.14万吨,水运货运量为8260.93万吨。2012-2018年发布时间:2021-09-10
 2012-2018年青海省货运量该数据包含了2012-2018年青海省货运量。2018货运量 为18904.86万吨,铁路货运量 为3220.05万吨,公路货运量 为15684.8万吨。2012-2018年发布时间:2021-10-15
 2012-2018年四川省货运量该数据包含了2012-2018年四川省货运量。2018货运量 为187385.33万吨,铁路货运量 为7199.08万吨,公路货运量 为173324万吨,水运货运量 为6862.25万吨。2012-2018年发布时间:2021-10-15
 2012-2018年重庆市货运量该数据包含了2012-2018年重庆市货运量。2018货运量 为128491.02万吨,铁路货运量 为1967.47万吨,公路货运量 为107064万吨,水运货运量 为19459.55万吨。2012-2018年发布时间:2021-10-15


