"2012亚太设计年鉴"相关数据
更新时间:2024-11-142019世界能源统计年鉴
In particular,the data compiled in this year's Review suggest that in 2018,global energy demand and carbon emissions from energy use grew at their fastest rate since 2010/11,moving even fur ther away from the accelerated transition envisaged by the Paris climate goals.
BP's economics team estimate that much of the rise in energy growth last year can be traced back to weather-related effects,as farmilies and businesses increased their demand for cooling and heating in response to an unusually large number of hot and cold days.The acceleration in carbon emissions was the direct result of this increased energy consumption.
Even if these weather effects are short-lived,such that the growth in energy demand and carbon emissions slow over the next few years,there seems lttle doubt that the current pace of progress is inconsistent with the Paris climate goals.The world is on an unsustainable path:the longer carbon emissions continue to rise,the harder and more costly will be the eventual adjustment to net-zero carbon emissions.Yet another year of growing carbon emissions underscores the urgency for the world to change.
The Statistical Review provides a timely and objective insight into those developments and how that change can begin to be achieved.
The strength iท energy consumption was reflected acroรs all the fuels,many of which grew more strongly than their recent historical averages.This acceleration was particularly pronounced for natural gas,which grew at one of its fastest rates for over 30 years,accounting for over 40% of the growth in primary energy.On the supply side,the data for 2018 reinforced the central importance of the US shale revolution.
【更多详情,请下载:2019世界能源统计年鉴】
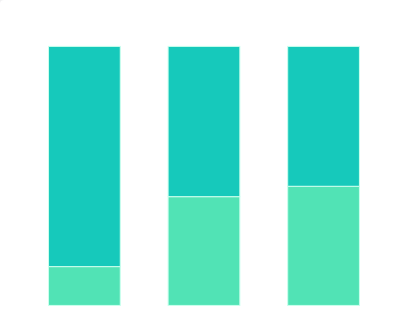
 2020年亚太REITs市场各物业类型年化综合收益率该统计数据包含了2020年亚太REITs市场各物业类型年化综合收益率。其中医疗健康REITs的十年期综合回报为13.1%。2020年发布时间:2021-09-24
 2018年亚太地区健身会员渗透率情况该统计数据包含了2018年亚太地区健身会员渗透率情况。2018年中国大陆前十城市健身会员渗透率为1.0%。2018年发布时间:2020-07-24
 2018年亚太地区健身会员渗透率该数据包含了2018年亚太地区健身会员渗透率。澳大利亚渗透率为15.3%。2018年发布时间:2020-02-14
 2019年亚太地区消费者递送地点偏好情况该统计数据包含了2019年亚太地区消费者递送地点偏好情况。韩国消费者偏好家庭住址占比最高,占比90%。2019年发布时间:2020-09-04
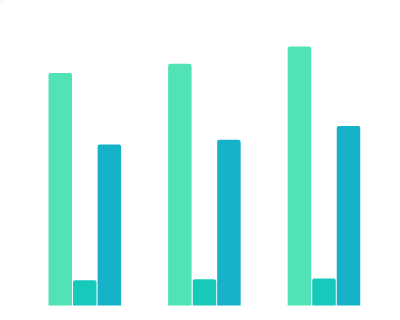 2008-2018年亚太地区煤炭产量该统计数据包含了2008-2018年亚太地区煤炭产量。2018年亚太地区煤炭产量为2853.1百万吨油当量。2008-2018年发布时间:2020-04-16
 2019年亚太地区消费者会在何时查看退货政策情况该统计数据包含了2019年亚太地区消费者会在何时查看退货政策情况。在购买商品前占比最高,占比42%。2019年发布时间:2020-09-04
 2019年亚太地区审查国际供应商的主要流程情况该统计数据包含了2019年亚太地区审查国际供应商的主要流程情况。使用搜索引擎查找该企业的更多相关信息占比最高,占比53%。2019年发布时间:2020-09-04
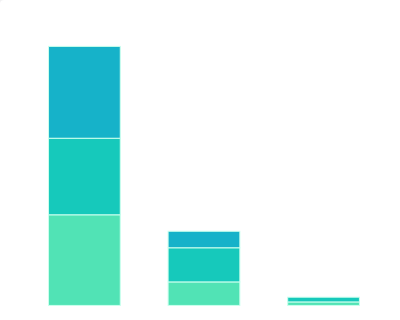 2019年亚太地区企业采购者会在何时查看退货政策情况该统计数据包含了2019年亚太地区企业采购者会在何时查看退货政策情况。中国香港在签订合同或进行购买前占比最高,占比78%。2019年发布时间:2020-09-04
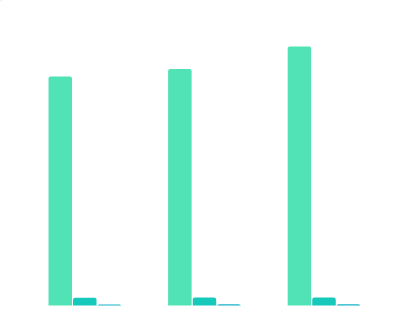 2008-2018年亚太地区发电量该统计数据包含了2008-2018年亚太地区发电量。2018年亚太地区发电量为12273.6太瓦时。2008-2018年发布时间:2020-05-09
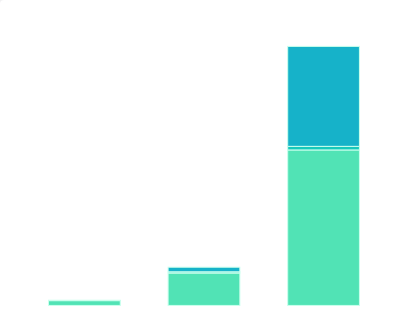 2017年亚太地区分燃料发电量该统计数据包含了2017年亚太地区分燃料发电量。2017年亚太地区发电量总计为11578.2太瓦时。2017年发布时间:2020-05-23
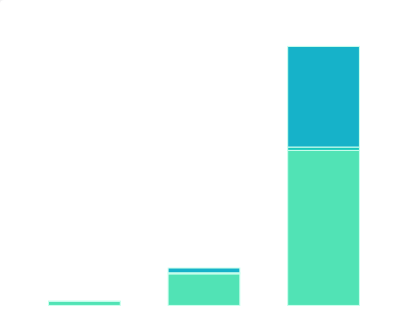 2018年亚太地区分燃料发电量该统计数据包含了2018年亚太地区分燃料发电量。2018年亚太地区发电量总计为12273.6太瓦时。2018年发布时间:2020-05-23
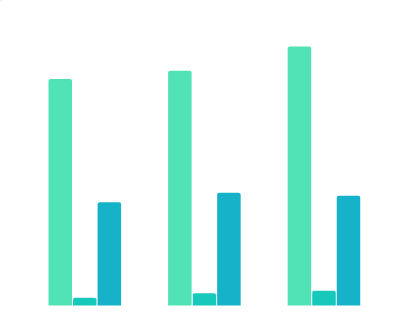 2008-2018年亚太地区生物燃料产量该统计数据包含了2008-2018年亚太地区生物燃料产量。2018年亚太地区生物燃料产量为13938.0千吨油当量。2008-2018年发布时间:2020-05-09
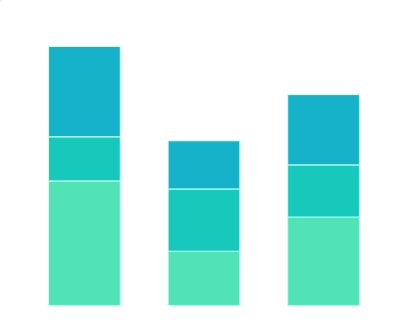 2019年亚太地区消费者受欢迎的研究工具情况该统计数据包含了2019年亚太地区消费者受欢迎的研究工具情况。韩国比价网站占比最高,占比64%。2019年发布时间:2020-09-04
 2020年中国受访者对服务设计的发展态度该统计数据包含了 2020年中国受访者对服务设计的发展态度。其中认为国内服务设计行业尚未成形的占比为86.60%。2020年发布时间:2020-12-04
 2019年亚太地区网购消费者放弃购物的原因情况该统计数据包含了2019年亚太地区网购消费者放弃购物的原因情况。运费超过预期占比最高,占比39%。2019年发布时间:2020-09-04
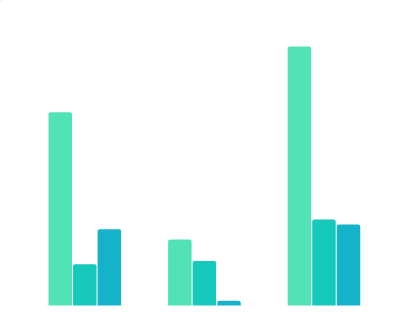 2018年底亚太地区煤炭探明储量该统计数据包含了2018年底亚太地区煤炭探明储量。2018年亚太地区煤炭探明储量为444888.0百万吨。2018年发布时间:2020-04-16
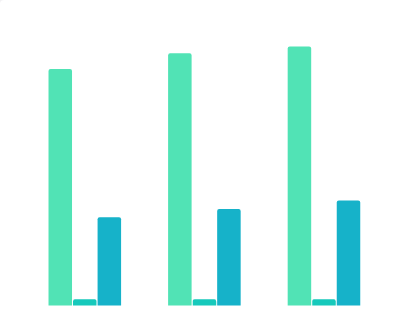 2008-2018年亚太地区石油炼厂产能该统计数据包含了2008-2018年亚太地区石油炼厂产能。2018年亚太地区石油炼厂产能为34752.0千桶/日。2008-2018年发布时间:2020-04-16
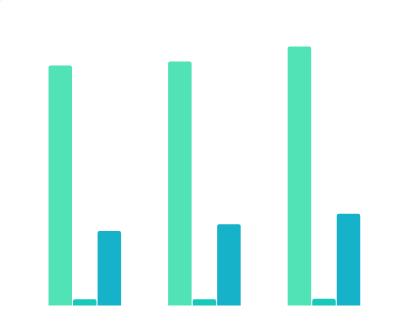 2008-2018年亚太地区石油原油加工量该统计数据包含了2008-2018年亚太地区石油原油加工量。2018年亚太地区石油原油加工量为29751.0千桶/日。2008-2018年发布时间:2020-04-16
 2008-2018年亚太地区石油消费量该统计数据包含了2008-2018年亚太地区石油消费量。2018年亚太地区石油消费量为35863.0千桶每日。2008-2018年发布时间:2020-04-16
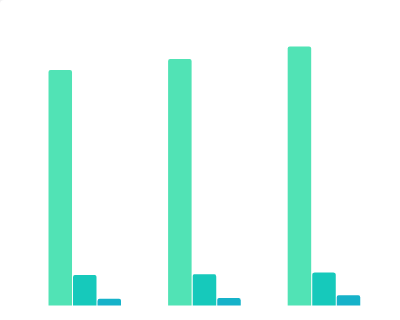 2008-2018年亚太地区核能消费量该统计数据包含了2008-2018年亚太地区核能消费量。2018年亚太地区核能消费量为125.3百万吨油当量。2008-2018年发布时间:2020-05-06


