"网络经济的优势和发展前景"相关数据
更新时间:2024-05-302019年整合网络经济报告
Foreword by Andrew Sullivan, President and CEO, Internet Society
The Internet Society develops its Global Internet Reports to bring significant features of the Internet's evolution to the attention of the global Internet community. The report normally contains some recommendations about the topic, proposing action to be taken or avoided as the topic and conditions warrant. This year, we examine the topics of concentration and consolidation on the Internet.
There can be little question that the Internet is facing change due to concentration and consolidation. The two patterns are linked but nevertheless distinct. We can observe the patterns at several levels:
Transit on the Internet is consolidating. Long-haul transit operators are becoming fewer but larger because of mergers and acquisitions. Even in access provisioning, some jurisdictions are seeing fewer, larger ISPs and consolidated offerings across the market, Delivery of standard Internet services is consolidating in large providers. For several years now, for example, most Simple Mail Transport Protocol (SMTP) traffic has come from just a few mail service providers, who provide that service for a very large percentage of Internet users.
【更多详情,请下载:2019年整合网络经济报告】

 1960-2017年全球已收到的净官方发展援助和官方援助(现价美元)该数据包含了1960-2017年已收到的净官方发展援助和官方援助(现价美元)。中国1979为16850000,1980为65500000,1981为475900000,1982为523380000,1983为668800000。1960-2017年发布时间:2020-07-16
 1960-2017年全球已收到的净官方发展援助和官方援助(2013年不变价美元)该数据包含了1960-2017年已收到的净官方发展援助和官方援助(2013年不变价美元)。中国1979为43520000,1980为155670000,1981为1198020000,1982为1264300000,1983为1625020000。1960-2017年发布时间:2020-07-16
 2016年天津市优势产业主要经济指标该数据包含了2016年天津市优势产业主要经济指标。全市总计企业单位数为4896个。2016年发布时间:2021-12-29
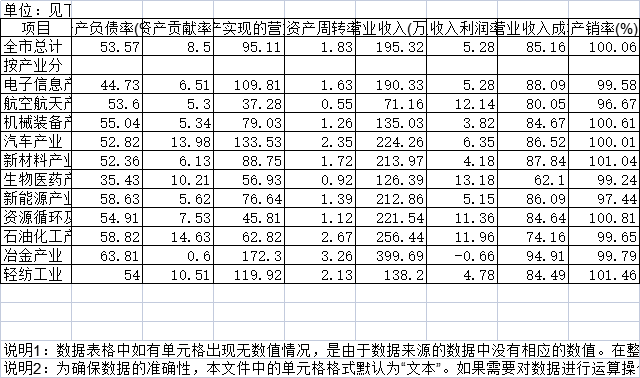
 2020年天津市优势产业主要经济效益指标该数据包含了2020年天津市优势产业主要经济效益指标。全市总计资产负债率为53.57%。2020年发布时间:2022-06-27
 2018年天津优势产业主要经济效益指标该数据包含了2018年天津优势产业主要经济效益指标。全市总计资产负债率57.17%。2018年发布时间:2021-03-10
 1960-2017年全球已收到的净官方发展援助(现价美元)该数据包含了1960-2017年已收到的净官方发展援助(现价美元)。中国1979为16850000,1980为65500000,1981为475900000,1982为523380000,1983为668800000。1960-2017年发布时间:2020-07-16
 1960-2017年已收到的官方发展援助(ODA)净额占GNI的百分比该数据包含了1960-2017年已收到的官方发展援助(ODA)净额(占GNI的百分比)。中国1979为0.009451393212747338,1980为0.03426642436047934,1981为0.2430751805069978,1982为0.2548581509918406,1983为0.2888194874503281。1960-2017年发布时间:2020-07-16
 1960-2017年已收到的官方发展援助(ODA)净额占总资本形成的百分比该统计数据包含了1960-2017年已收到的官方发展援助(ODA)净额(占总资本形成的百分比)。2016年中国已收到的官方发展援助净额占总资本形成的-0.0160%。1960-2017年发布时间:2020-07-16
 1972-2017年获得的净官方发展援助(ODA)净额占中央政府支出的百分比该数据包含了1972-2017年获得的净官方发展援助(ODA)净额(占中央政府支出的百分比)。中国2013为-0.05680428555895201,2014为-0.05567342156762765,2015为-0.01828275192912916。1972-2017年发布时间:2020-07-16
 2006-2015年全球174个国家和地区官方发展援助总额中奖学金的支出奖学金的定义是“为单个学生提供的经济援助奖以及对受训者的贡献。2006-2015年发布时间:2020-07-02
 1960-2017年已收到的官方发展援助(ODA)净额占进口货物和服务的百分比该数据包含了1960-2017年已收到的官方发展援助(ODA)净额(占进口货物和服务的百分比)。中国1982为2.678368558415639,1983为3.18385223269542,1984为2.938826650943396,1985为2.272947386261834,1986为2.874895002099958。1960-2017年发布时间:2020-07-16
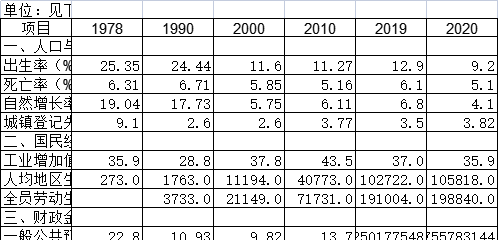
 截至2020年福建省国民经济和社会发展比例和效益指标该数据包含了截至2020年福建省国民经济和社会发展比例和效益指标。出生率1978为25.35‰。2020年发布时间:2022-08-24
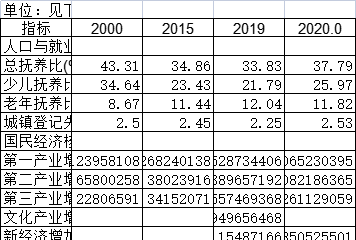
 截至2020年广东省国民经济和社会发展比例和效益指标该数据包含了截至2020年广东省国民经济和社会发展比例和效益指标。总抚养比2000为43.31%。2020年发布时间:2022-05-17
 截至2009年北京市国民经济和社会发展比例和效益指标该数据包含了截至2009年北京市国民经济和社会发展比例和效益指标。常住人口出生率2009为8.06。2009年发布时间:2021-09-14
 截至2012年北京市国民经济和社会发展比例和效益指标该数据包含了截至2012年北京市国民经济和社会发展比例和效益指标。常住人口出生率2012年9.05‰。2012年发布时间:2021-09-02
 截至2013年北京市国民经济和社会发展比例和效益指标该数据包含了截至2013年北京市国民经济和社会发展比例和效益指标。常住人口出生率2013为8.93。2013年发布时间:2021-08-25
 截至2014年北京市国民经济和社会发展比例和效益指标该数据包含了截至2014年北京市国民经济和社会发展比例和效益指标。常住人口出生率2014为9.75。2014年发布时间:2021-07-21
 截至2016年北京市国民经济和社会发展比例和效益指标该数据包含了截至2016年北京市国民经济和社会发展比例和效益指标。常住人口出生率2016为9.32‰。2016年发布时间:2021-07-21
 2009年浙江省个体和私营经济发展情况该数据包含了2009年浙江省个体和私营经济发展情况。户数个体合计为1986913户。2009年发布时间:2021-06-10
 2010年浙江省个体和私营经济发展情况该数据包含了2010年浙江省个体和私营经济发展情况。户数个体合计为2122141户。2010年发布时间:2021-06-09


